We don’t mean to alarm you but we like to provide many varied opinions to arm you with as much information as possible in order that you can make informed investment decisions.
Here’s some commentary we stumbled across from Graham Summers, Chief Market Strategist at Phoenix Capital Research, an independent investment research company.
He uses three key market metrics to make the case stocks are in a bubble and the air is going to come out soon.
**
by Graham Summers, Chief Market Strategist, Phoenix Capital Research
As I’ve been outlining over the last few days, stocks are in a bubble.
The evidence is clear from multiple angles.
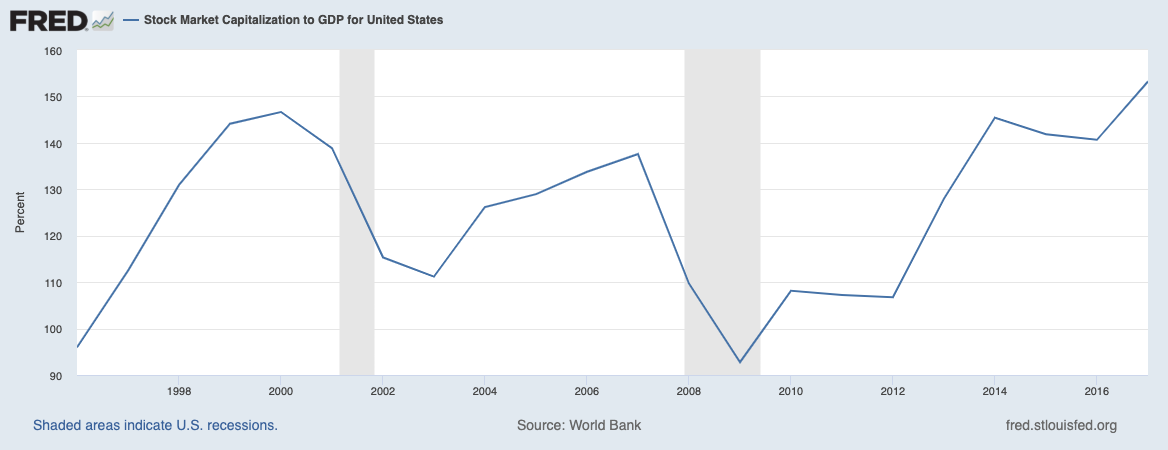
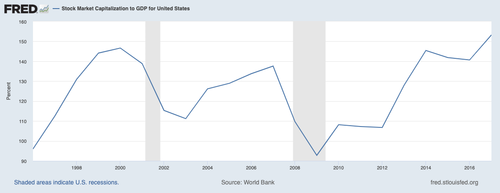
One of the simplest is Warren Buffett’s favorite indicator: the Stock Market Capitalization to GDP ratio.
Buffett famously used this ratio as the justification for avoiding the Tech Bubble in the late ’90s. As the below chart shows, the current bubble is even larger than that!
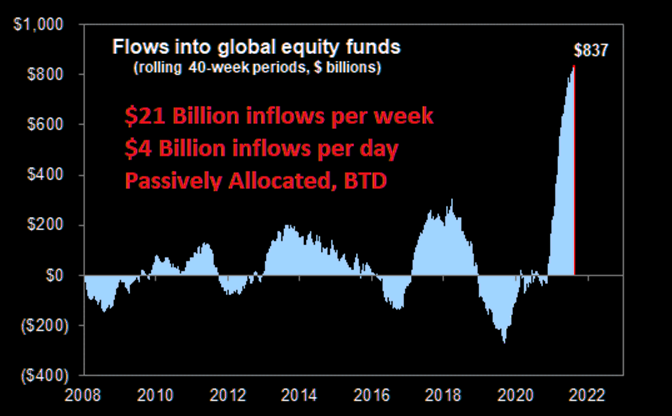
Another means of determining whether or not the market is in a bubble is from fund inflows, which measures how much capital investors are putting into stocks.
After all, in order to have a genuine bubble, we need to see mania from investors as they dump their money into stocks.
Well, investors are pouring hundreds of billions of dollars into stocks today at a pace far exceeding anything like the last 12 years. Indeed, as CNBC noted earlier this year, investors have put more money into stocks in the last five months than in the prior 12 years combined.

Finally, we can assess whether or not stocks are in a bubble based on how stretched they are above historic norms.
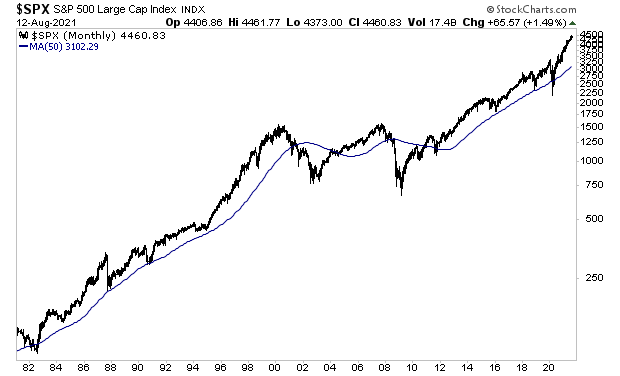
One of my favorites is the 50-month moving average (MMA). As you can see in the below chart, one of the clearest signs of stocks entering a bubble is when they become extremely stretched above this line.
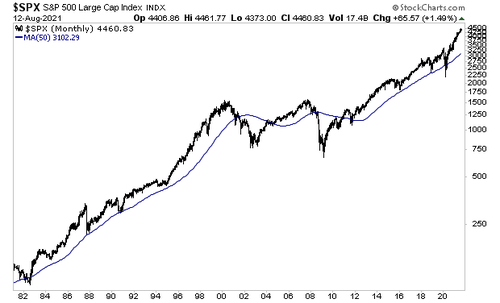
Obviously, today stocks area quite stretched above this line. However, the above chart makes it somewhat difficult to gauge just how far they are extended.
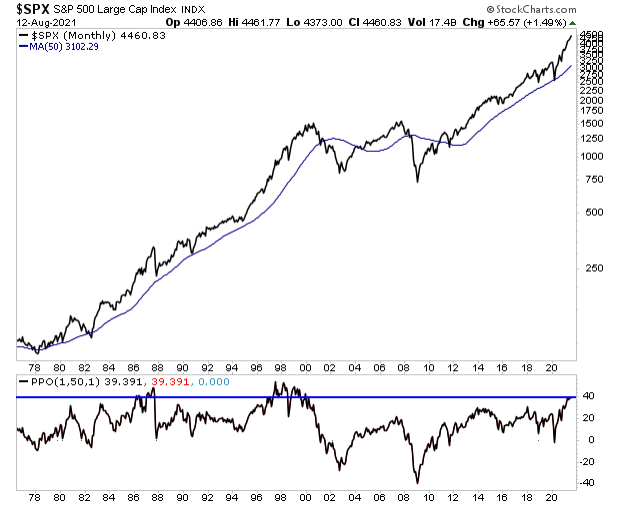
The bottom box in the below chart shows just how extended above the 50-MMA the S&P 500 is in a percentage.
Today, the market is about 40% above the 50-MMA.
It has only been higher three times in the last 40 years: right before the 1987 Crash and the twice during the Tech Bubble.

So again, stocks are clearly in a bubble. It’s now just a matter of figuring out when it bursts.
Related stories: 10 Biggest Market Risks Right Now