
How can an investor assess the true value of a technology company that has strong revenue growth but modest profit? The Rule of 40 can help.
This formula is often used to value software companies and increasingly technology companies in general.
Jason Donville, President & CEO, Donville Kent Asset Management, and Jesse Gamble, Senior VP & Portfolio Manager, crunch the numbers of some tech companies in Canada and the US and present their findings in this excerpt from their ROE Reporter newsletter.
by Jason Donville and Jesse Gamble, Donville Kent Asset Management
The Rule of 40
Many value-creating technology companies can achieve exceptional revenue growth while showing modest profitability.
One popular method for assessing the balance between a technology company’s revenue growth and profitability is the Rule of 40.
This concept is typically used to evaluate software companies and is increasingly being applied to a range of digitized businesses.
The Rule of 40 indicates that a software-as-a-service (SaaS) company’s combined revenue growth rate and profit margin should be at least 40%.
For a tiny SaaS company, this can be a relatively easy number to hit but as a company grows, only truly exceptional companies will exceed 40%.
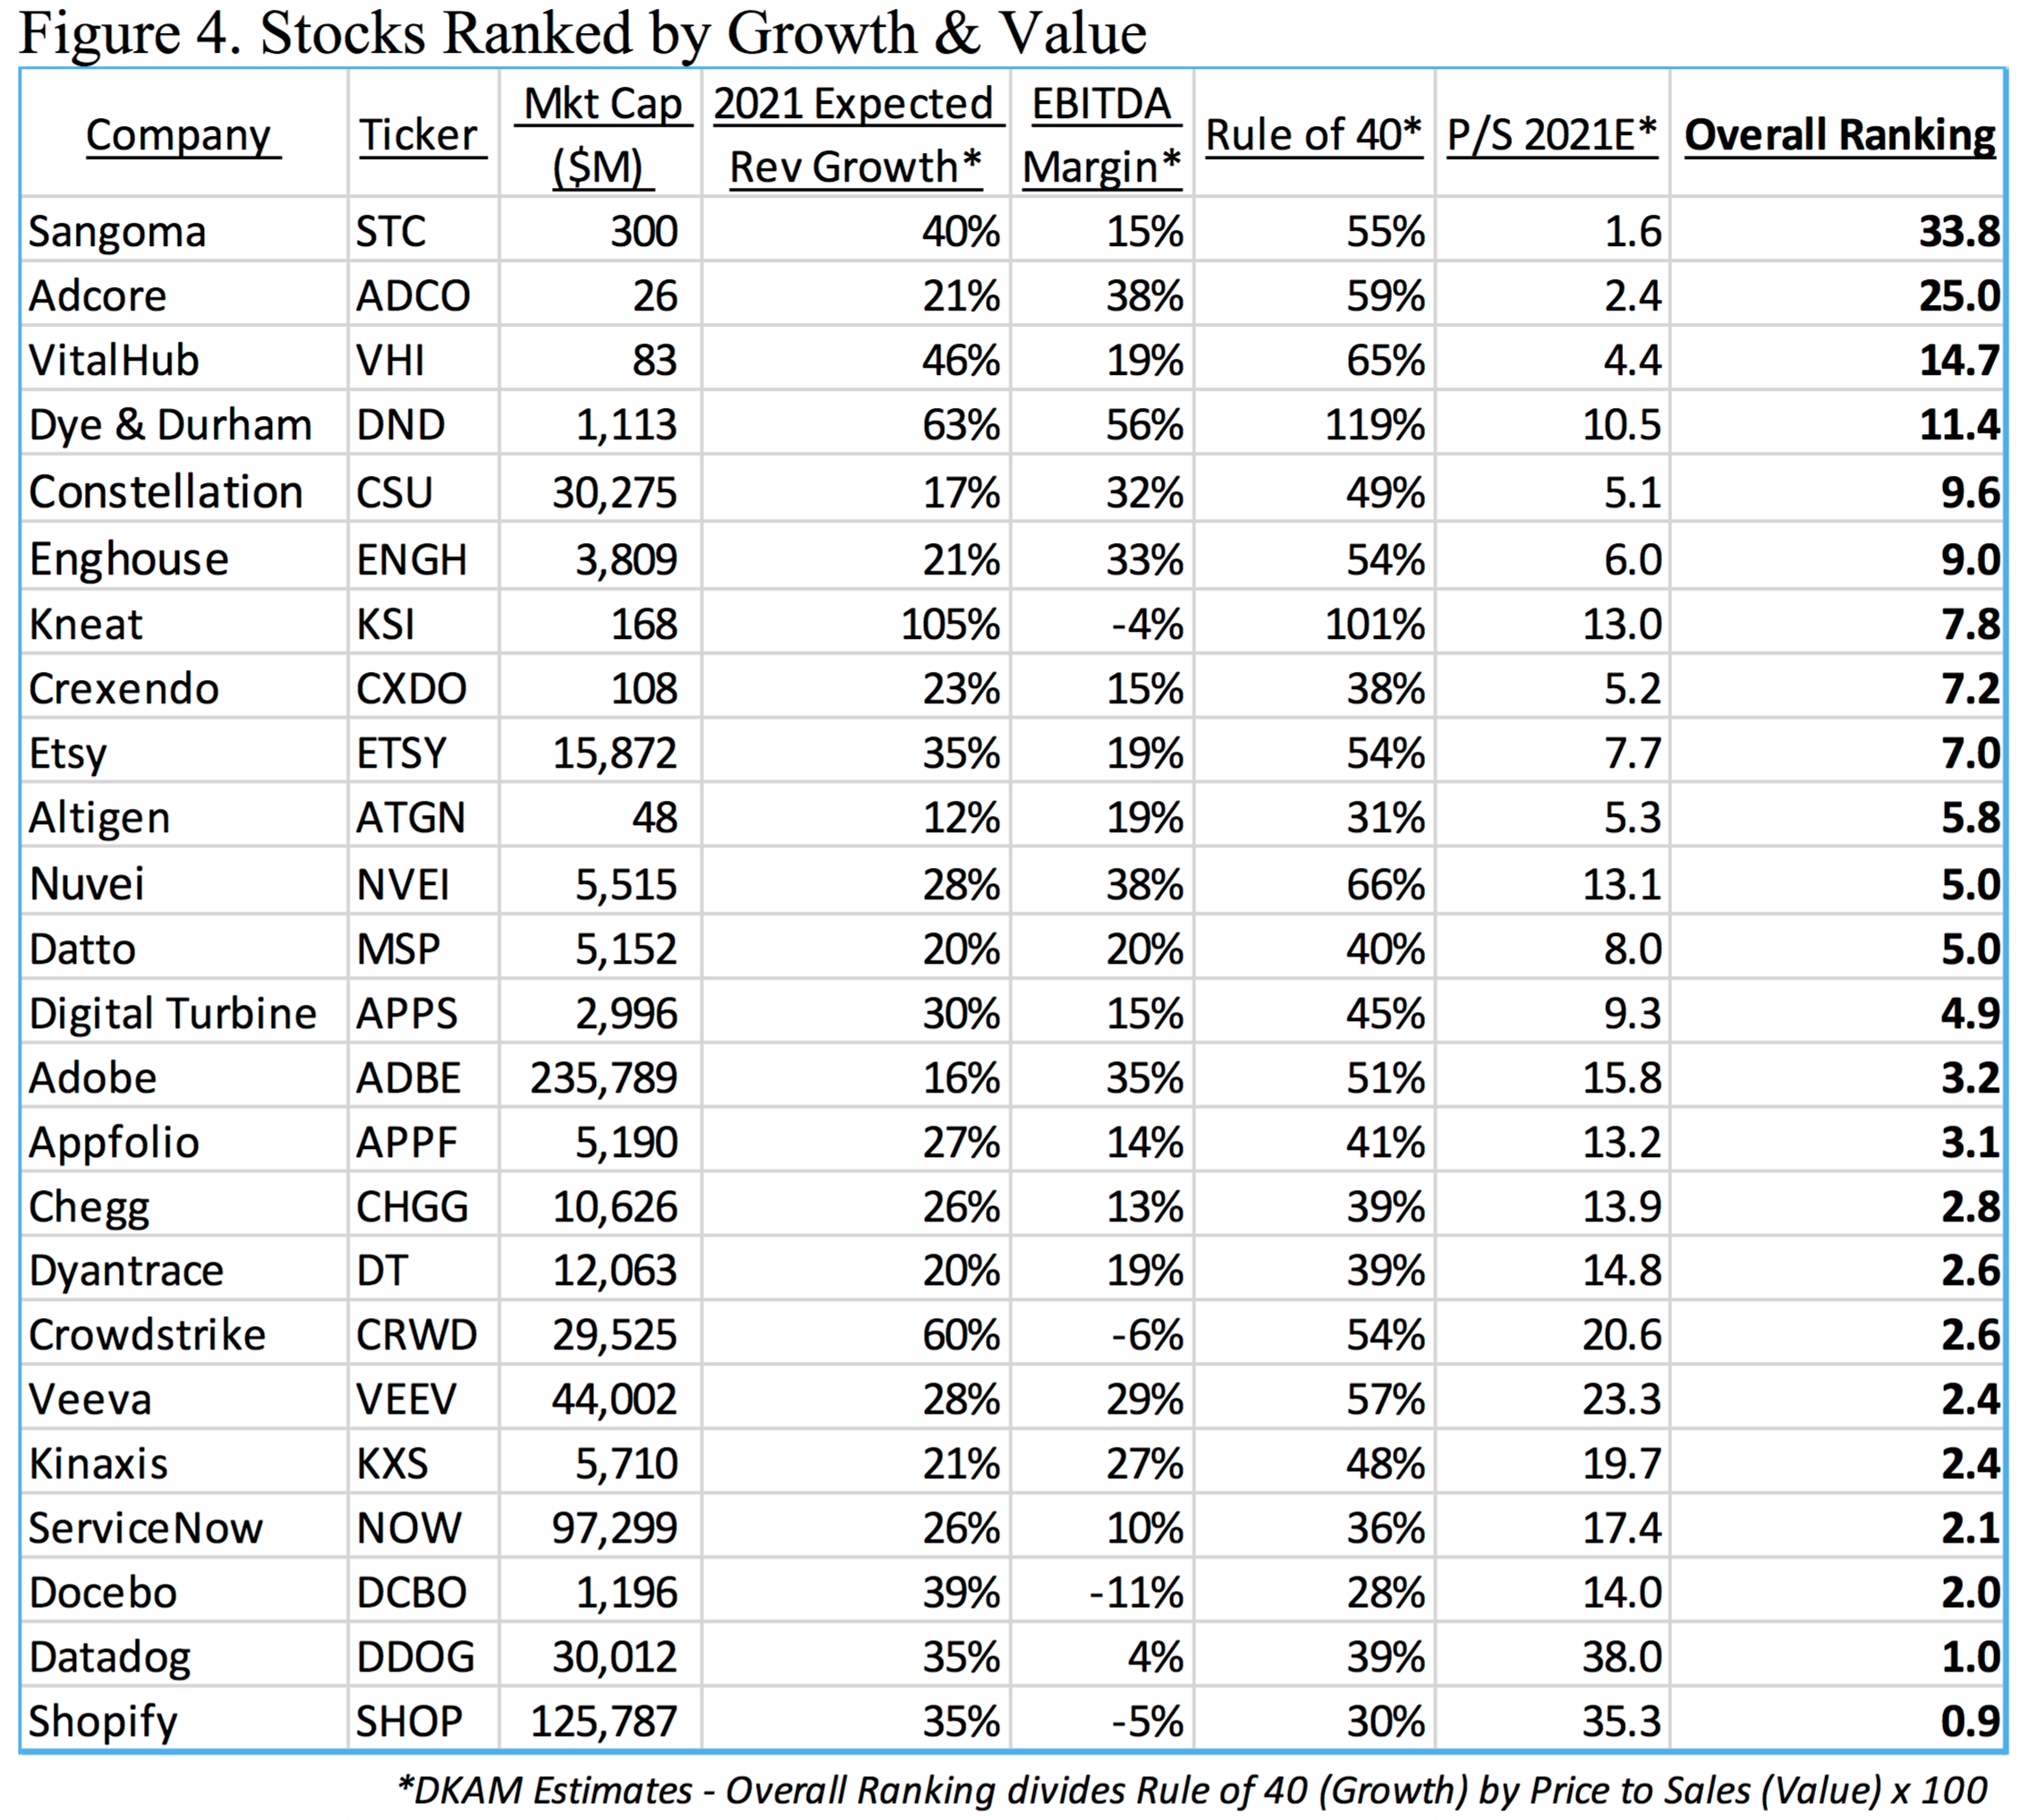
In figure 1 below, we highlight selected companies in Canada and the US that look compelling strictly based on the Rule of 40.

What about valuation?
Given the unique way in which technology companies create value, where most or all of its profits are reinvested via the income statement to grow sales, we need a more robust metric than earnings to assess the valuation of these companies.
At a high level, there are two simple approaches to this issue:
(i) Price-to-sales (“P/Sales”)
(ii) Normalized earnings
The simplest way to value a technology company is to examine its P/Sales multiple rather than its price-to-cash earnings (P/CE) multiple.
This is a popular, straightforward method and it can be a powerful tool, particularly when looking at homogenous technology companies.
Sometimes sales or sales growth can be misleading, but there are other techniques for assessing the quality of a company’s sales and sales growth that we will discuss another time.
Nonetheless, the P/Sales multiple is a quick and generally effective way to investigate how expensive a tech company is.

Normalized Earnings
By exploring the income statement of a technology company, the sales and marketing expenses can be adjusted or normalized to gauge how profitable thecompany is.
It’s not uncommon for a technology company to spend more than 50% of its revenue on sales and marketing. In comparison, a company outside of the technology sector might spend only 15-20% of revenues on sales and marketing expenses.
By normalizing the sales and marketing expense for a technology company with rapidly increasing revenues, we can quickly identify which companies have the strongest potential to be highly profitable tomorrow if they slowed down their sales and marketing spend.

In our past newsletters we explain why combining high return on equity (ROE) and low cash earnings multiple get you a better sense of the growth to value trade-off.
In general terms, a lot of the highest growth companies in the market are overvalued while the cheapest stocks are cheap for good reason.
Ranking growth versus value does a good job to weed out the extremes. In this example, we will combine figure 1 and figure 2 to get a better sense of what stocks look attractive.
The ultimate goal of stock market investing is to uncover companies that create significant value in a consistent and recurring manner.
Such companies, if successful, will be worth substantially more in 5-10 years than they are today.
While the Fund does not invest exclusively in technology companies, we are seeing some incredibly promising technology companies in Canada and the US that we feel are trading at attractive valuations.
Image source:
Related stories:
High-Growth Low Profit Companies Still Create Value. Here’s How