The Nasdaq Composite Index has registered its 66th correction (a drop of 10 per cent or more from a recent peak) since its inception 50 years ago.
How has the index fared after those occurrences?
We’ve got answers.
**
The Nasdaq Composite Index on Wednesday booked its first close in correction territory since March.
A rapid surge in Treasury yields and expectations for interest-rate increases from the Federal Reserve are being blamed for weakness in the formerly highflying benchmark.
The technology-heavy index is off to a terrible start (if you’re long the market) in 2022, closing Wednesday down 1.2% at 14,340.26, putting it lower 10.69% since its Nov. 19 peak, meeting the common definition for a correction in an asset’s value.
The benchmark finished below its 200-day moving average for the first time since April 2020 on Tuesday.
The Nasdaq has registered a correction 65 times (not including Wednesday’s) since it was launched in 1971, and of those corrections, 24 of them, or 37%, have resulted in bear markets, or declines of at least 20% from a recent peak, according to Dow Jones Market Data.
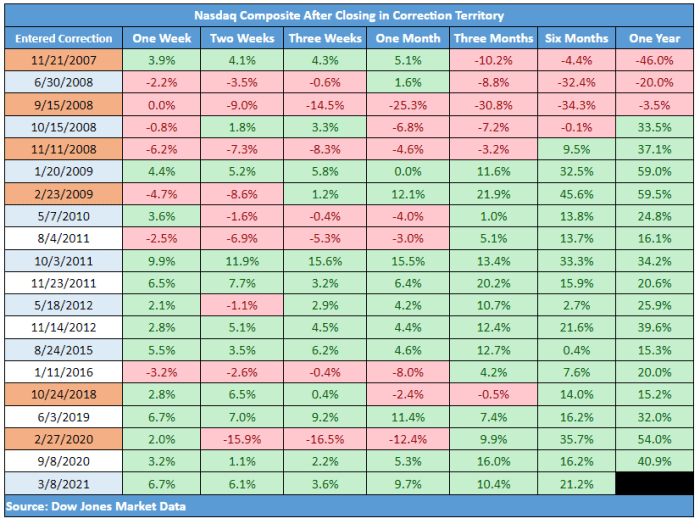
More recently, corrections have served as buying opportunities, with the sojourn into correction territory on March 8 resulting in subsequent gains for the one-week, two-week, three week and one-month periods, going all the way out to six months.
A similar uptrend took hold when the Nasdaq Composite slipped into correction territory in early September 2020.
What happens next is unclear but here’s a list of Nasdaq corrections during the 2000s, and what happened after that: