
It’s no secret that big tech stocks have been struggling.
MANTA, as Jesse Felder likes to call them – Microsoft, Amazon, Nvidia, Tesla, and Apple – are well down from their all-time highs.
Most investors with some savvy knew the good times couldn’t continue forever.
But there are two major forces at work that may explain the downturn in large tech stocks better than anything else.
Felder, Founder, Editor and Publisher of The Felder Report, examines those reasons along wth two charts that tell the story.
**
by Jesse Felder
April was the worst month for the Nasdaq since the stock market was in the throes of the Great Financial Crisis in 2008.
And it shouldn’t be hard to understand what is plaguing the Big Tech stocks that make up the bulk of this index.
In addition to capital flows, macro economic trends, risk appetites and insider activity, all of which warned of the current weakness in stock prices well ahead of time, there are two major bearish forces at work.
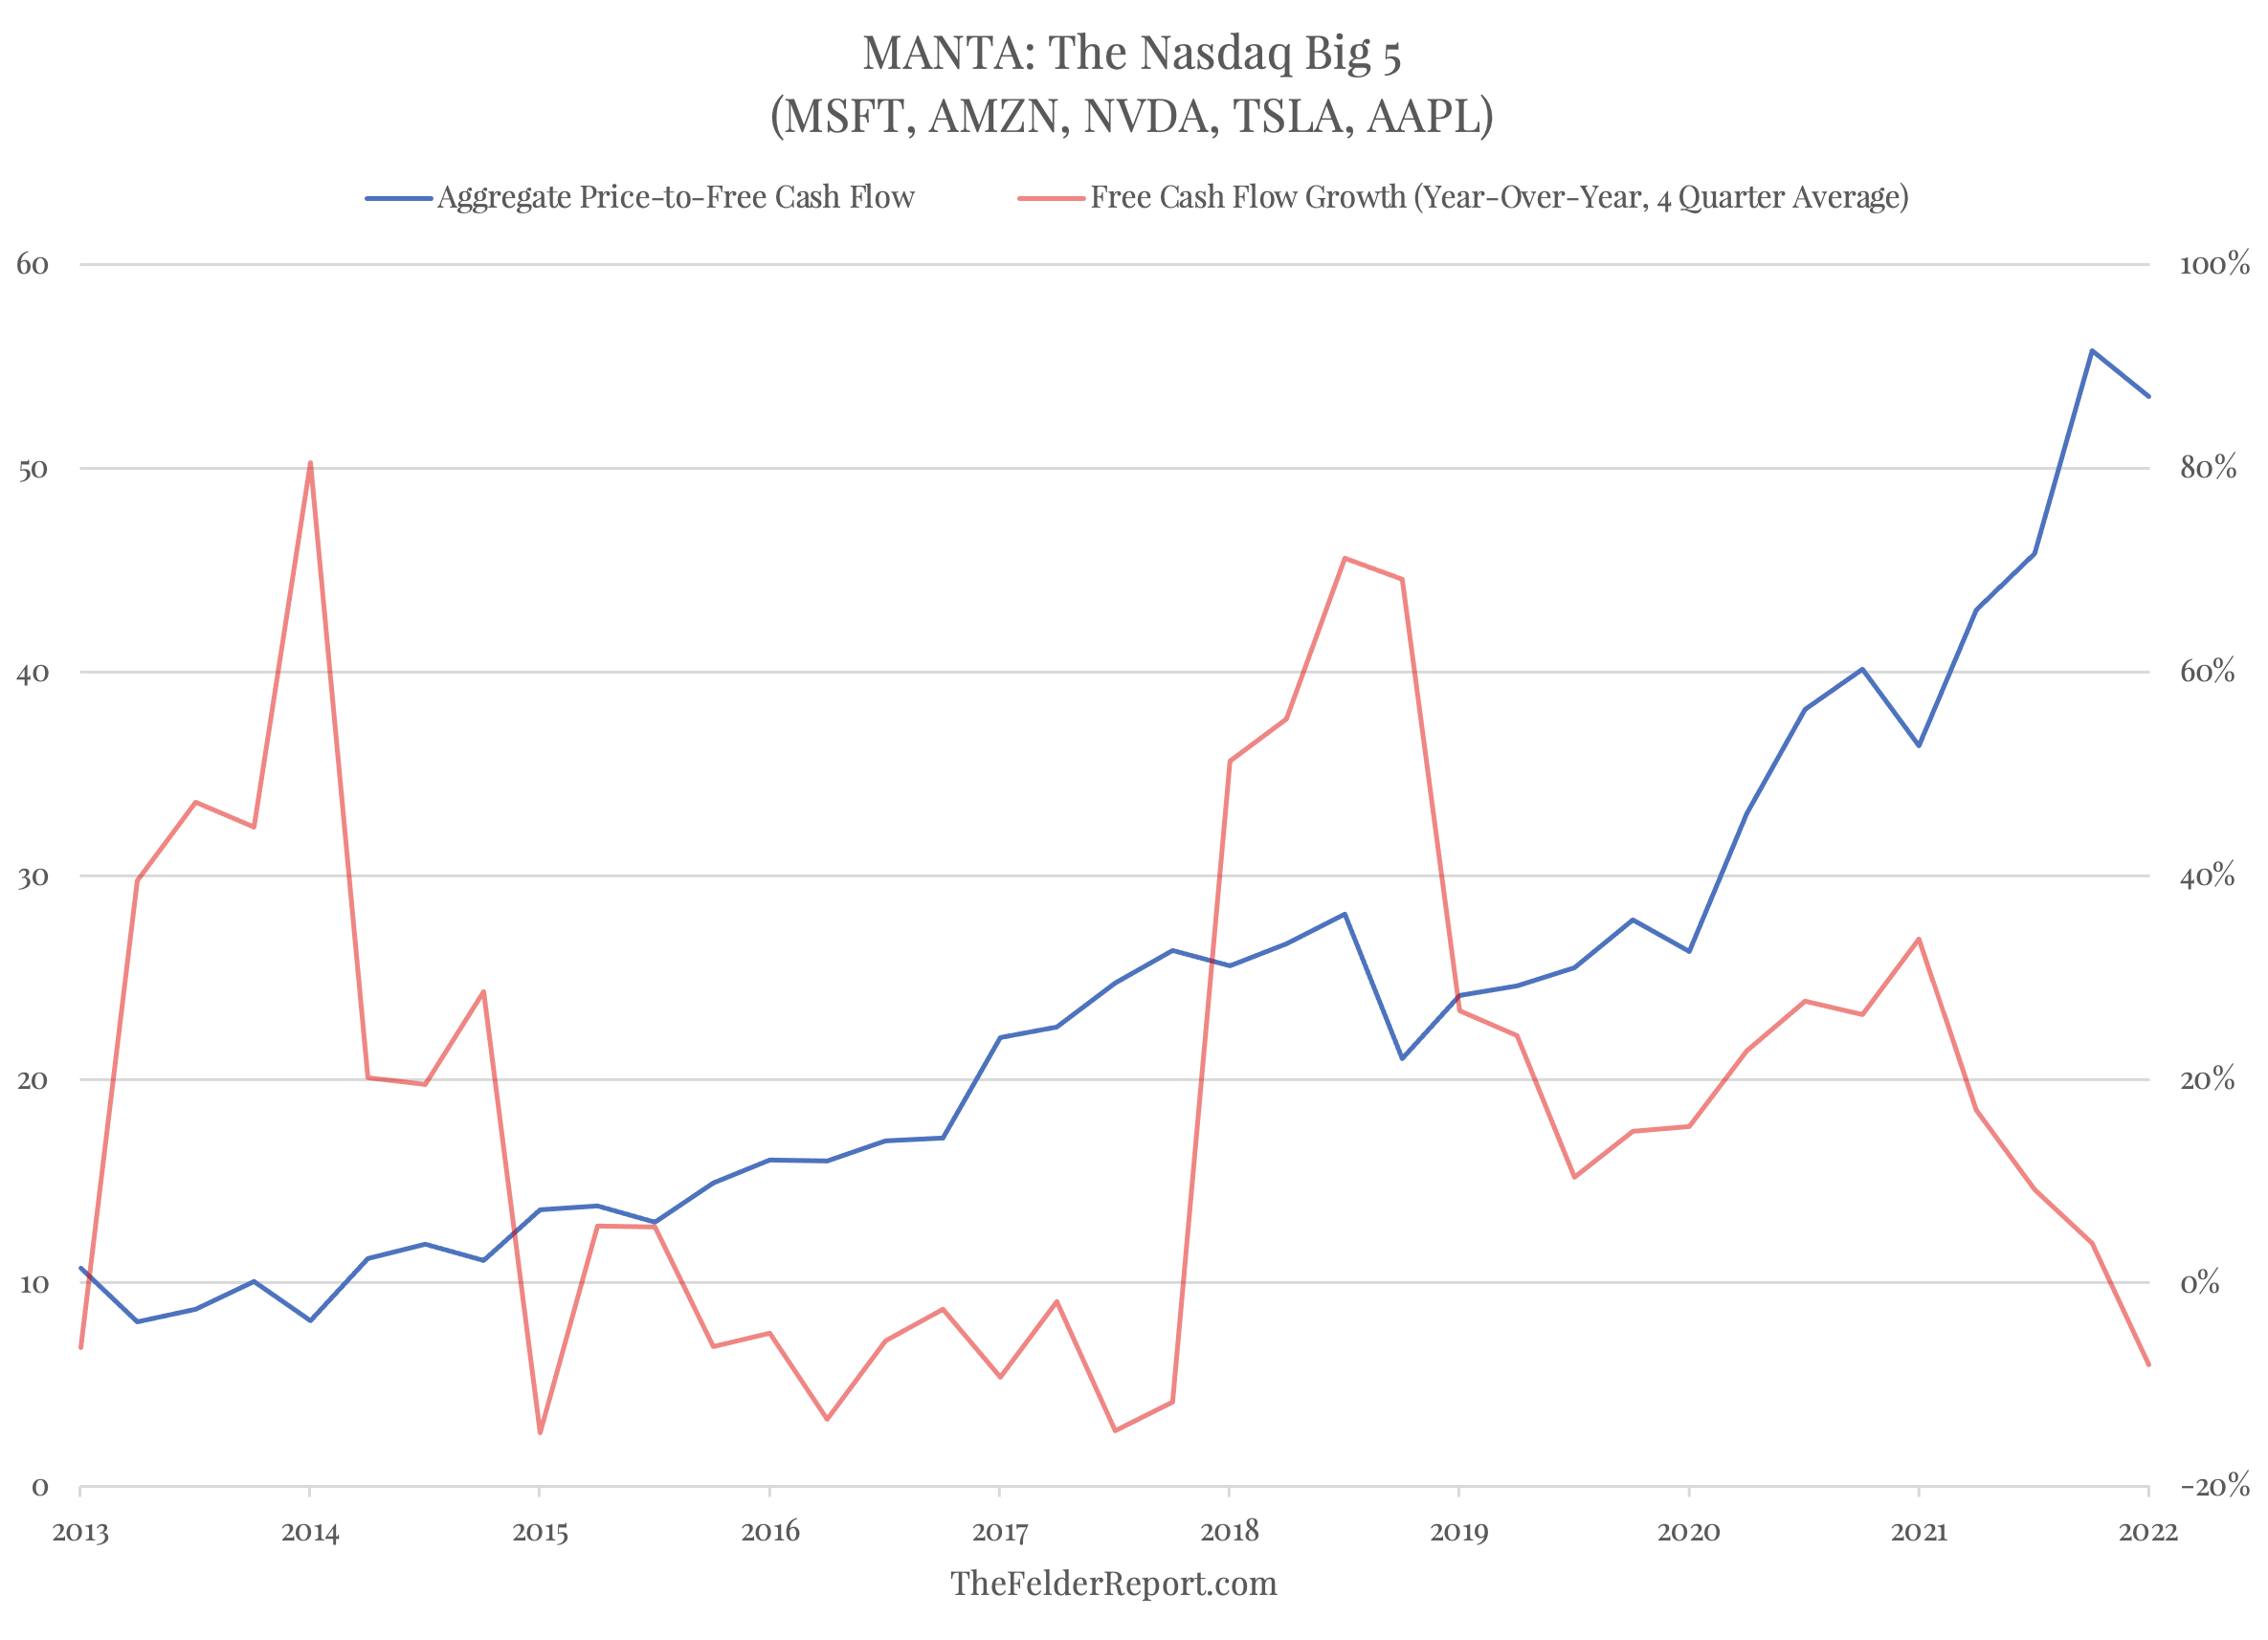
At the start of April, the five largest components of the index (Microsoft, Amazon, Nvidia, Tesla and Apple, aka MANTA) traded at about 55-times their aggregate free-cash-flow (and nearly 70-times when you back out stock based compensation).
Now that might not be totally obscene if it weren’t for the fact that free cash flow growth has recently turned negative.
In that context, however, it’s hard to see how the most extreme valuation in the history of this group is at all sustainable.
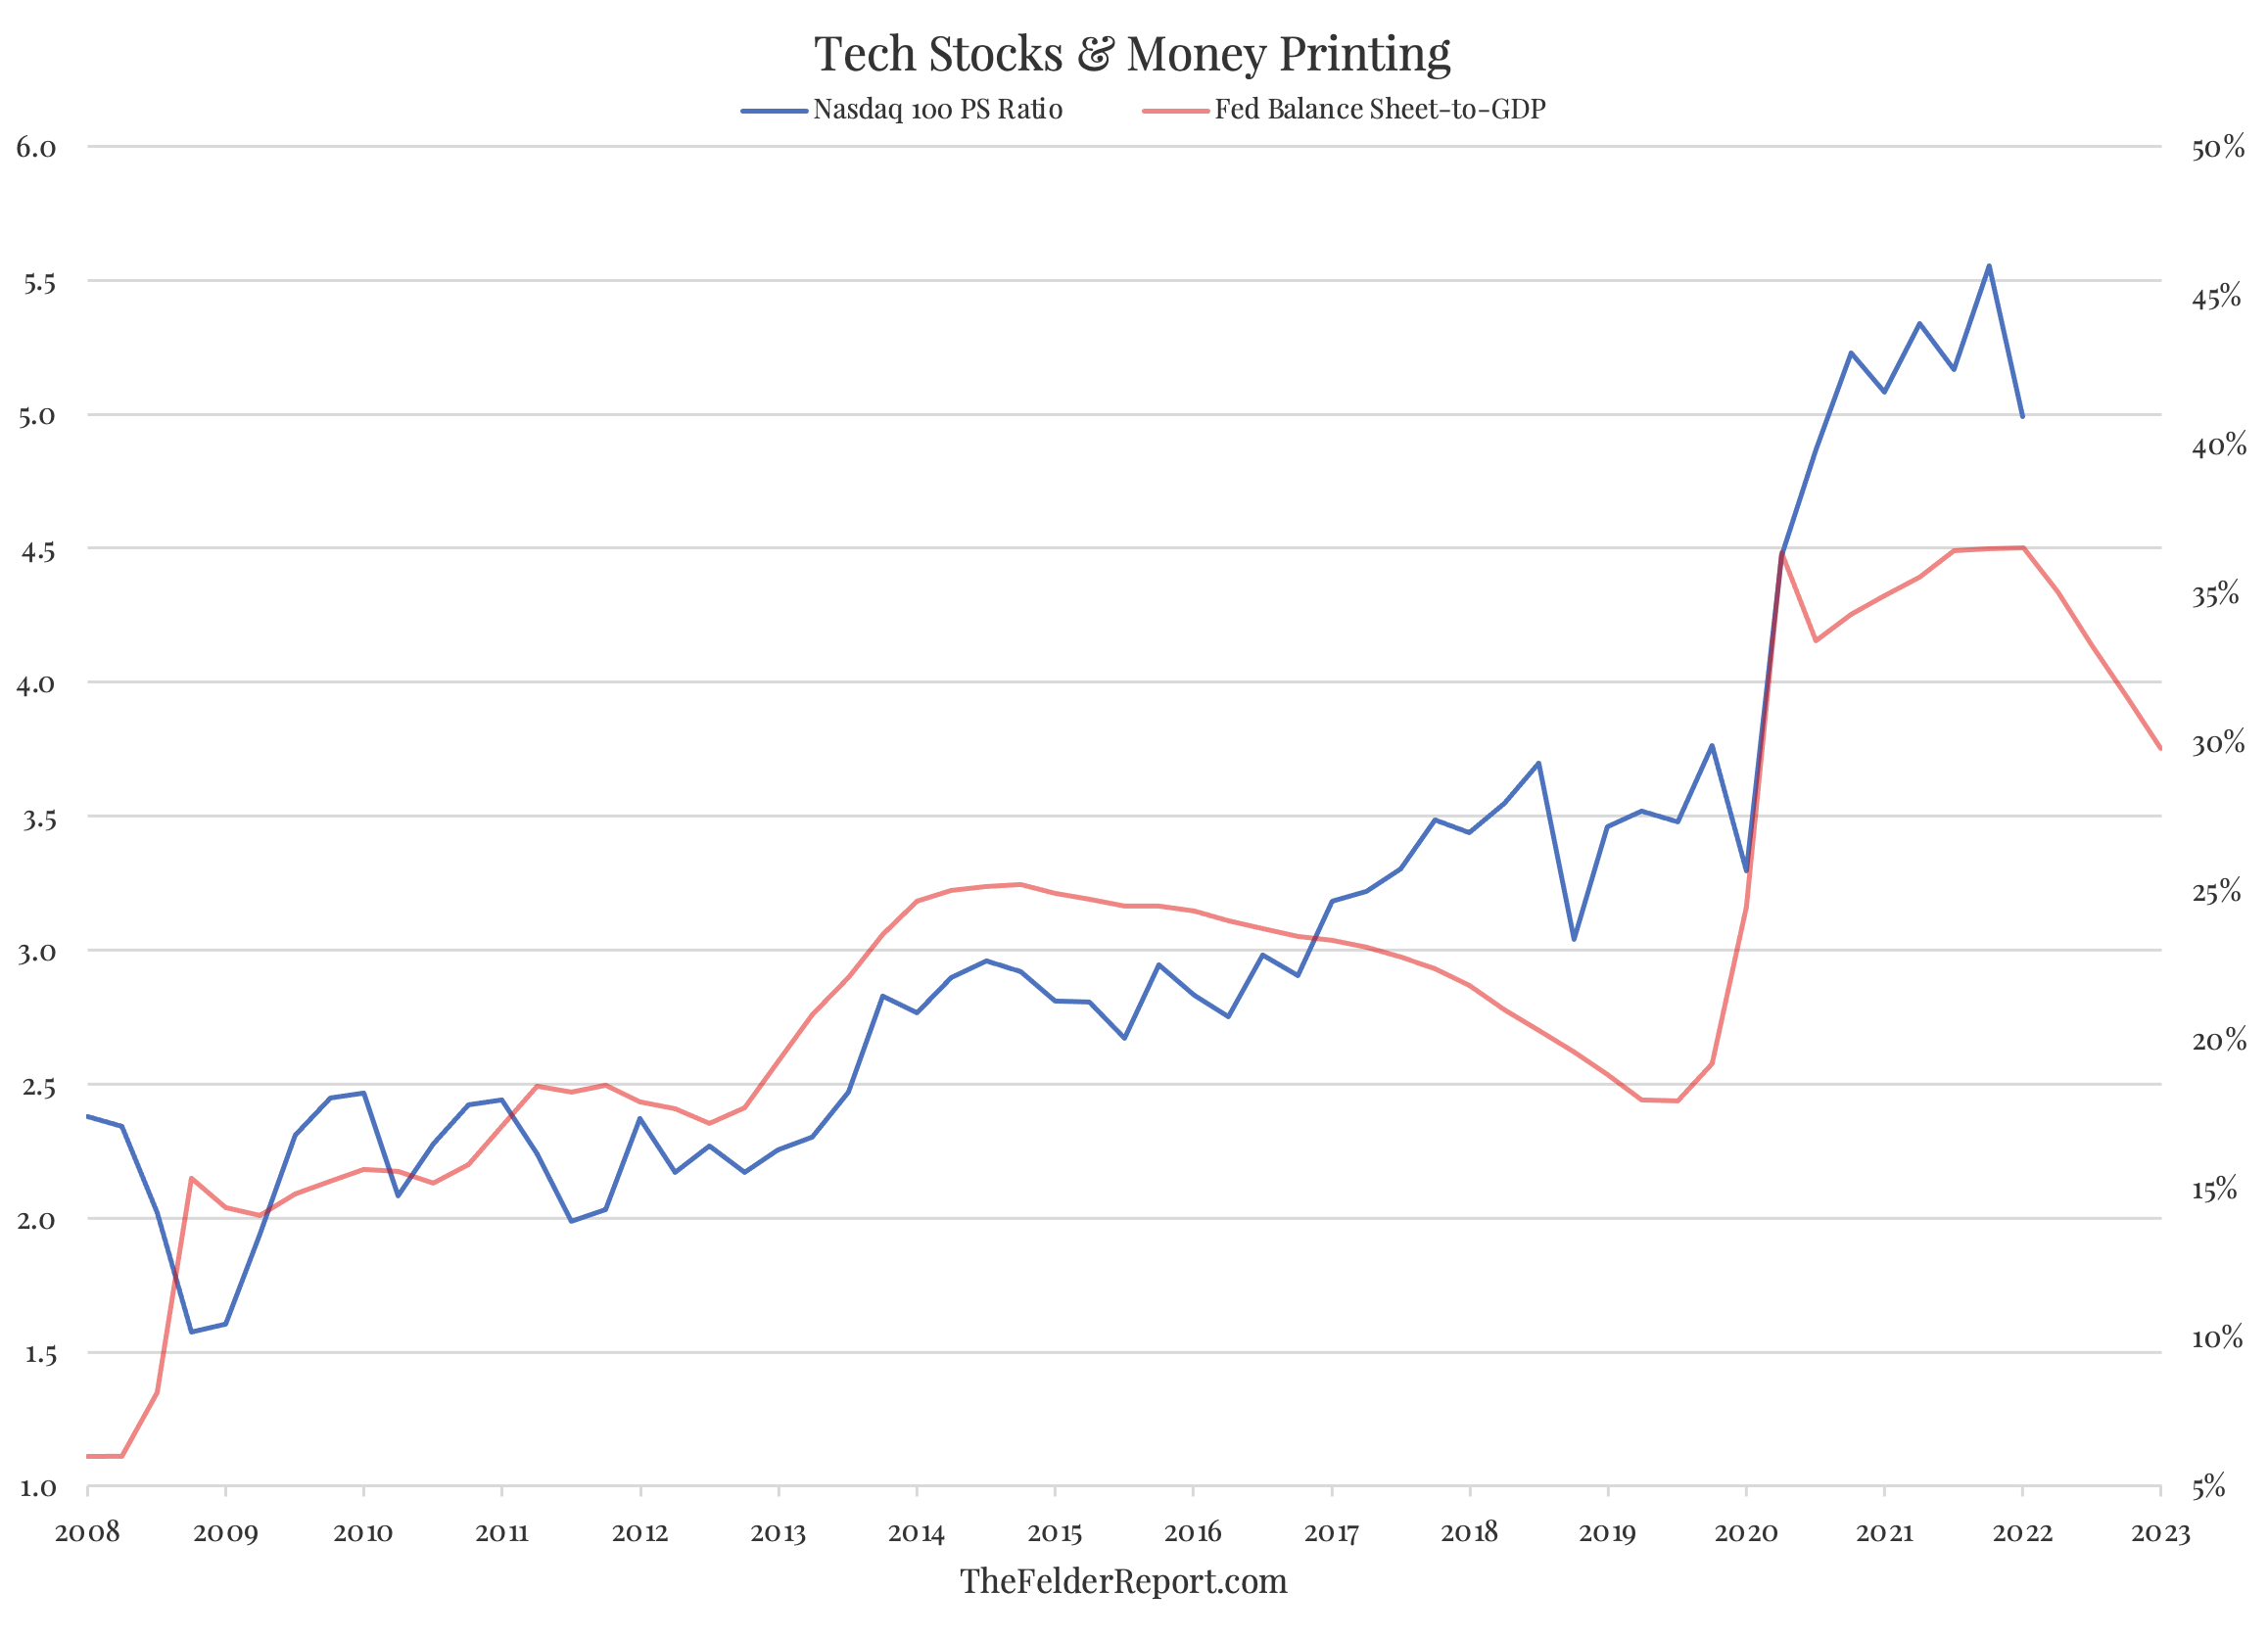
Of course, this is only half of the story.
The other half is told by the Fed’s balance sheet to which Nasdaq valuations are highly correlated.
We might infer from this relationship that money printing supports asset values and, when taken to an extreme, stokes “animal spirits” to the point at which a speculative mania is formed.
And, truly, this is a story as old as central banking.
The trouble for Big Tech is that raging inflation means the Fed will now have to put its money printer into reverse in an effort at reining in price pressures, not only in the real economy (where its tools are less effective) but also in the asset markets (where its tools are much more effective).
The bearish tandem of falling free cash flow and waning liquidity suggests extreme valuations could revert in a major way, depending on just how much and for how long free cash flow declines and by how much and for how long the Fed is committed to draining the markets of excess liquidity.
Considering the nature of the pandemic and the stimulus enacted as a result, it’s not unreasonable to think there was a significant pulling forward of demand for Big Tech products and services that will now leave a vacuum of demand for a prolonged period of time.
In addition, because inflation is now a bigger problem for the Fed than any time in the last 40 years, it may be far more difficult for the central bank to once again pivot away from hawkish policies should the stock market continue its decline.
If these concerns prove valid, the recession already underway in both free cash flow and liquidity could be more significant than investors have become accustomed to enduring over the course of this long bull market.
And the reversion in extreme valuations may have only just begun.
**
Related stories: These Two Charts May be the Most Important in the World Right Now