
The bond market usually gets it right.
And it’s saying Jerome Powell and his crew at the U.S. Federal Reserve may have already made another policy mistake.
The first was to not recognize that inflation in the spring of 2020 was starting to take flight.
It was transitory they said. Wrong-o.
Now, the Fed is projecting six more rate hikes by the end of this year.
This as economic growth and corporate profits are quickly returning to earth after last year’s temporary fiscal stimulus drove eye-popping first and second quarter GDP and earnings numbers.
Good luck to Industrials, Consumer Discretionary, and Financials sector companies, for example, in matching their triple digit second quarter 2021 earnings per share (EPS) growth in the second quarter of this year.
Estimates have EPS still growing double digits, with the exception of energy, but the rate of change slowdown will be massive.
Check out Hedgeye’s helpful S&P 500 Sales and EPS comparison chart.

There are two charts (see below) that really illustrate the Fed’s problem and show that attempting to continue to raise rates into a dramatic economic and profit slowdown will be virtually impossible.
The way U.S. Treasury yields moved on Wednesday after the Fed finally raised its key lending rate for the first time since 2018 was more instructive than what the major stock indices did.
Yes, stocks moved sharply higher into the market close but one could argue that was mostly hedge funds covering their short positions, and yes, there’s been some there’s follow through today (Thursday).
But bond yields post-Fed, which initially moved higher but then declined, are telling a different story.
One of the most important charts right now shows where traders, based on overnight index swaps* comparing one year expectations of where 10-year and two-year Treasury yields will be, believe that the yield curve is going to invert (two-year yield above the 10-year yield), which usually indicates a recession is coming.
Short-term yields reflect what the Fed is doing – raising rates – and longer term yields reflect economic growth prospects.
If the Fed continues with its plan to increase rates, stock market investors may not be able take the pain and the Fed, as it did in 2018, will be forced to halt its rate hiking cycle.
What does that mean for investors?
A safe place to hide would be in U.S. dollars (UUP), which should be in favour under that scenario.
In longer term government bonds (TLT), which should rise with yields eventually moving lower.
And in gold (GLD), which acts like a currency and likes it when rates are not going up.
Gold stocks could also benefit but, as we’ve seen when stock sell-offs become severe such as in March of 2020, investors will sell everything, including gold miners.
Here’s a look at an expected inverted yield curve one year out.

**
Now, please keep reading for Jesse Felder’s view of what he thinks may be the most important financial chart in the world at this moment.
by Jesse Felder, Founder, Editor, Publisher, The Felder Report
The long-term chart of the 30-year treasury yield may now be the most important chart in the world.
For the past 30 years or so, the yield on the long bond has formed a fairly neat channel that has only been violated relatively briefly at times.
The drop below 1%, at the height of the COVID panic, tested the lower end of that channel.
Since then, it has reversed higher and now appears poised to test the upper end.
This area also coincides with key horizontal resistance at 2.5% that dates back to the lows put in at the height of the Great Financial Crisis.
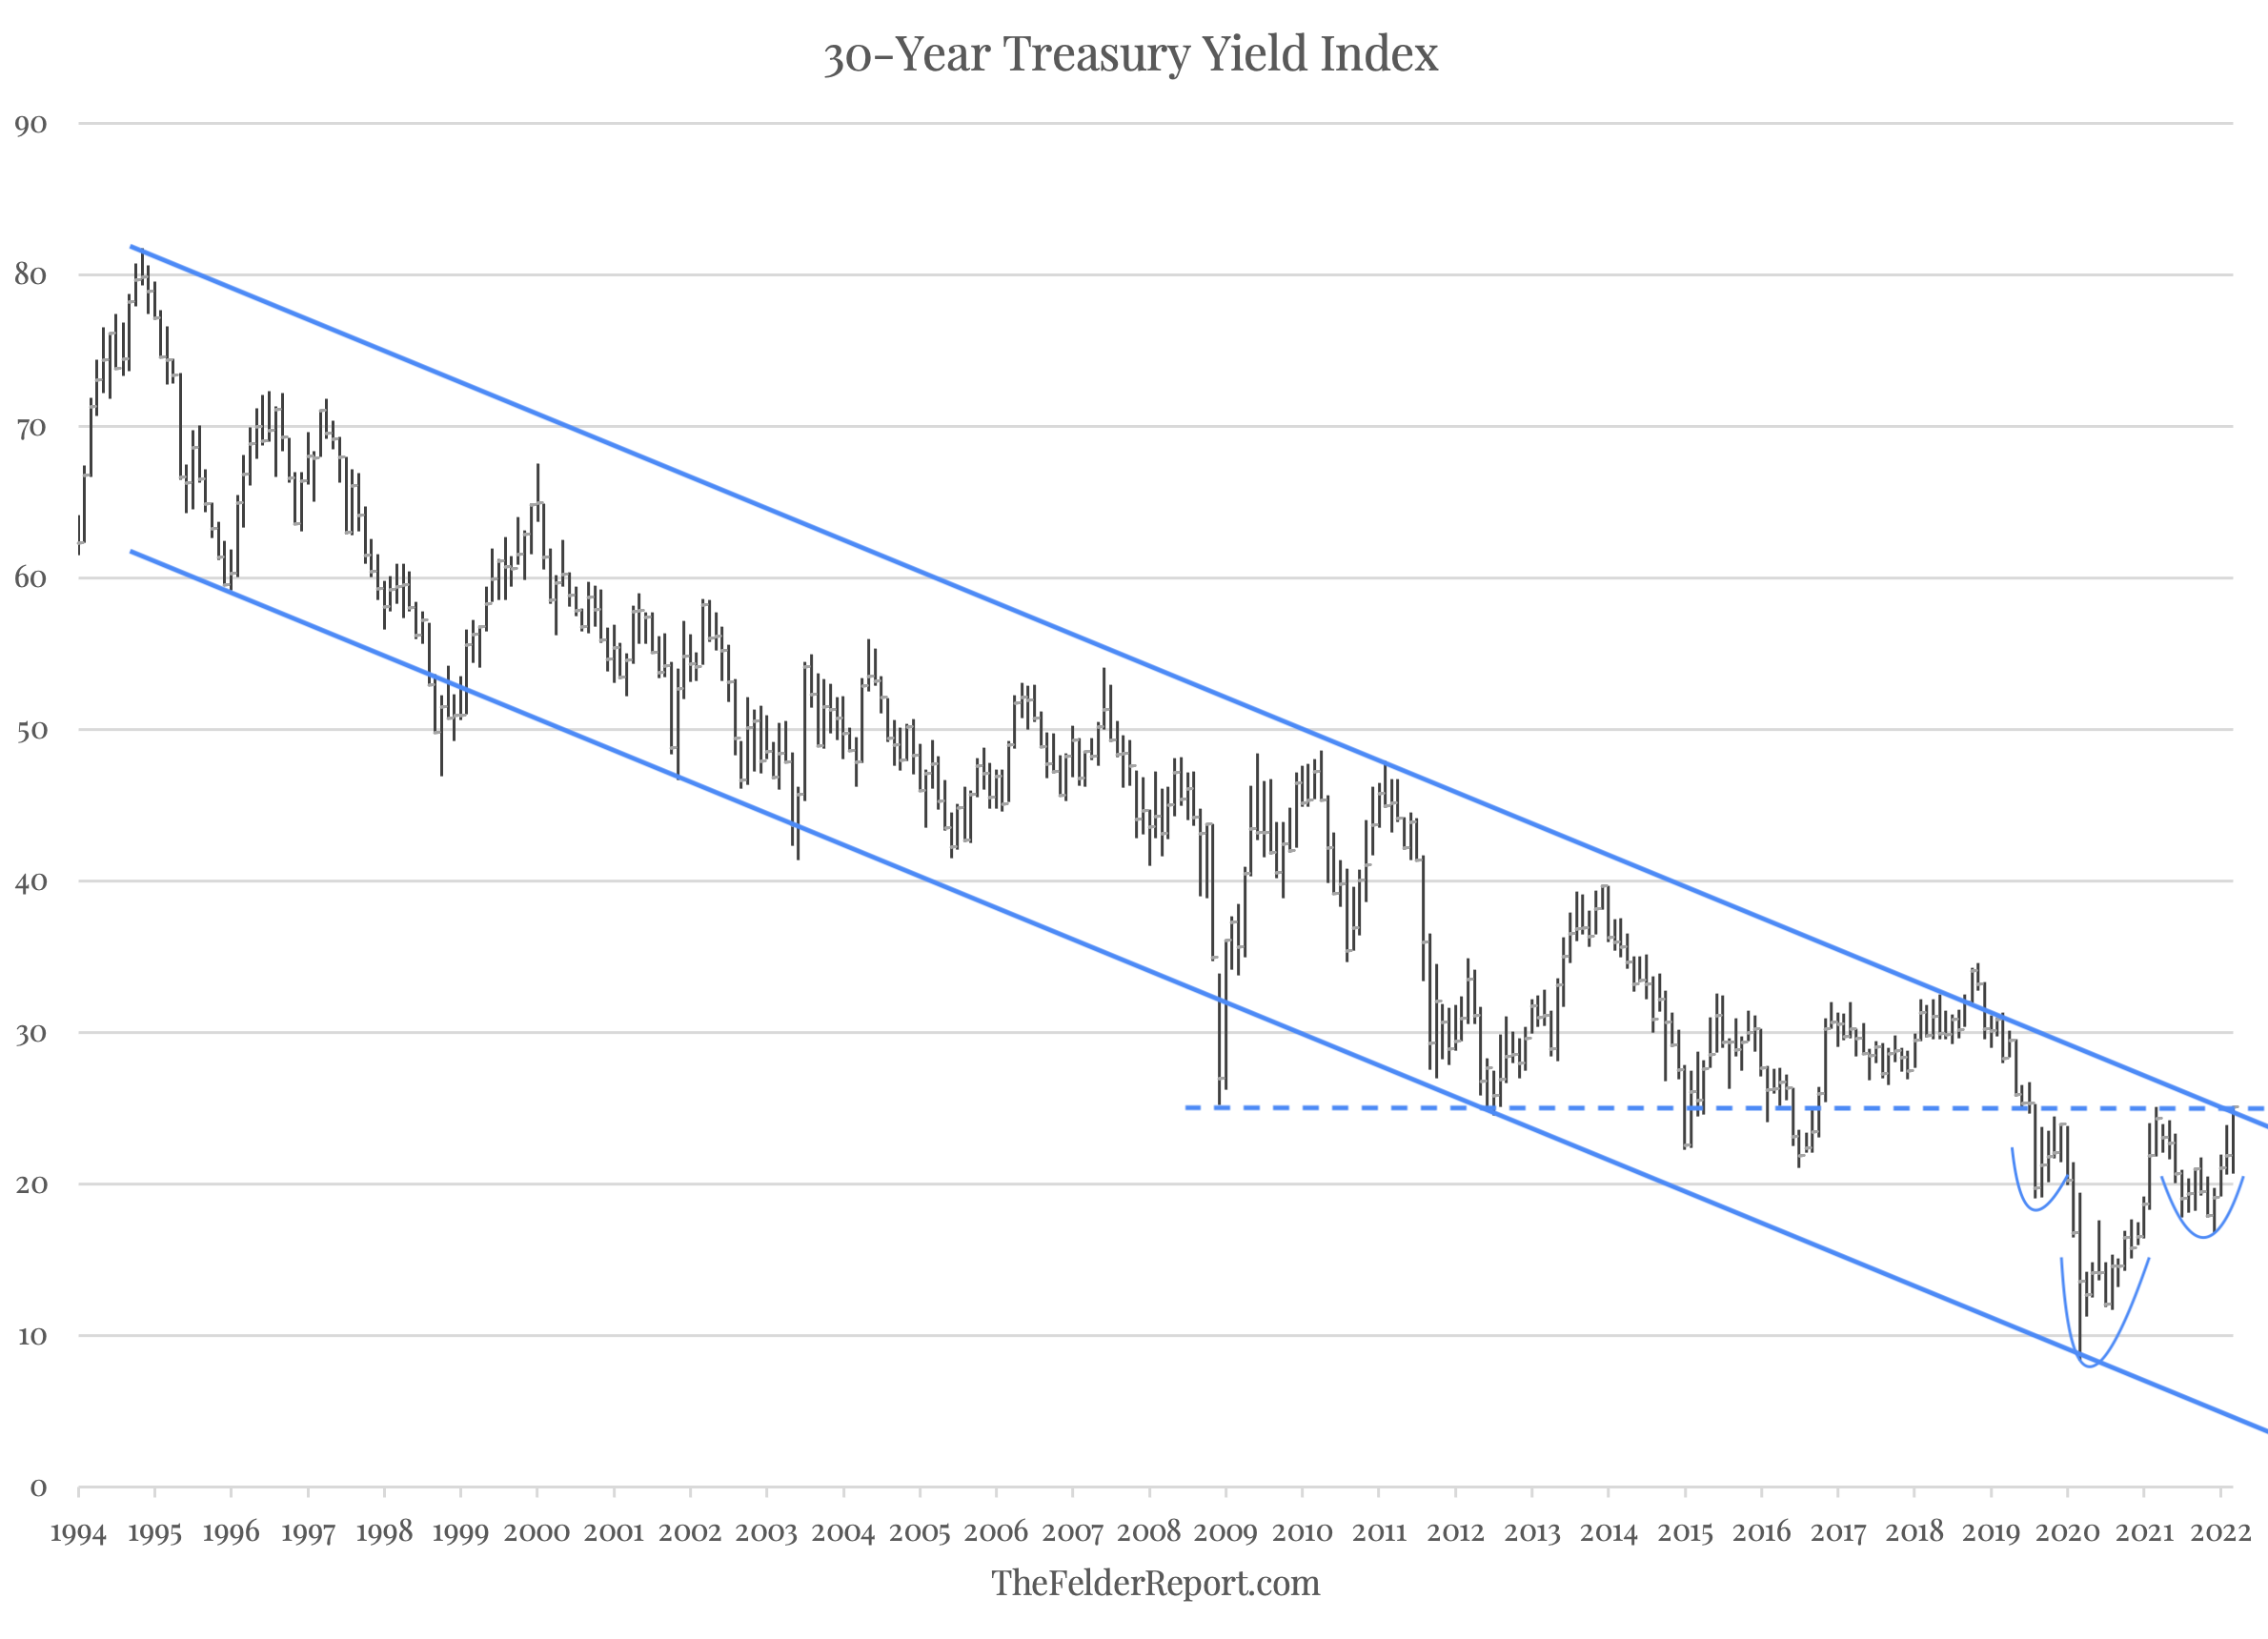
In reversing from its low two years ago, the 30-year yield has also formed a pretty clear inverted head and shoulders pattern so it appears we are at a crucial spot for the multi-decade bond bull market.
A reversal lower here for the long bond yield would suggest that the bull market remains intact; a breakout higher, however, would suggest it has finally come to an end.
It would also indicate that, after a very long hiatus, the bond vigilantes may have returned and are determined to pressure a Federal Reserve that has fallen further behind the curve than ever before.
**
I interviewed Hedgeye CEO Keith McCullough in August 2021. You can watch the full interview and read the transcript here.
**
Would you like a second opinion on your portfolio?
Get a complimentary consultation with John O’Connell, Chairman, Chief Executive Officer and Chief Investment Officer of Davis Rea Investment Counsel, the sponsor of Uncommon Sense Investor.
**
*Overnight Index Swaps (OIS) are interest rate swaps based on a specific currency that exchanges fixed rate interest payments for floating rate payments based on a notional swap principal at regular intervals over the life of the swap contract.
Related stories: Learning How to Lose is Key to Winning in the Market. Here’s Why.