
This is the latest in a series of ongoing stories about what many smart investors believe is a coming melt up in the stock market.
There are those who are eager to participate because big money can be made. And there are others who want no part of it.
Here are excerpts from an article by Enrique Abeyta of Empire Financial Research.
**
Folks always ask me, “What’s the craziest thing you’ve ever seen in the markets?”
Having lived – as an active investor – through the terrible events of 9/11, the Lehman Brothers Financial Crisis, the Long-Term Capital Management (“LTCM”) Crisis, and many other major events, I have plenty to choose from.
My answer, however, was always the “melt up” of the tech bubble in 1999 and 2000. Nothing ever compared to the “craziness” of that event… until 2021.
For many investors, this type of situation is concerning – and it is for me as well – but one of my favorite quotes to use recently comes from the legendary investor George Soros:
“When I see a bubble forming, I rush in to buy – adding fuel to the fire. That is not irrational.”
Soros understands that some of the most massive returns in the market happen during bubbles. In no other market would you see stocks going up 100%, 200%, or even 500% in a month.
Sometimes, we’re even seeing moves like that within a week.
When those kinds of returns exist, investors should absolutely figure out how to participate. But the key is how to participate and how to avoid the inevitable – and extremely painful – downturn.
The goal is to preserve the gains and figure out what to look for in a market reversal.
Let me be clear – the bursting of the bubble is coming, and we all need to be prepared.
Let’s consider the tech-heavy Nasdaq Composite Index during the move higher in the dot-com bubble. Here it is from 1995 through October 1999…

Then look at the massive leg up into March 2000, as the index hit its peak and began to pull back…
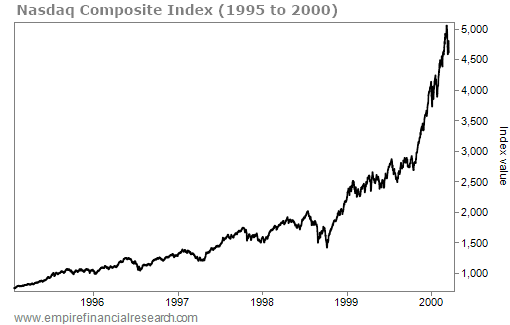
As you can see, the Nasdaq went from roughly 3,000 to roughly 5,000 – a 67% move higher – in just five months.
With that in mind, let’s see what the Nasdaq looks like now…

The chart looks a bit concerning.
The March 2020 bottom aside, what we see here is that since November 2019 (when I first started examining the similarities to the dot-com era) the Nasdaq is up roughly 75% across 15 months.
Now, that’s not five months like the ones I highlighted in 1999 and 2000. But this is still a massive move in a short time frame.
It’s impossible to absolutely identify the ‘top’ of any stock market bubble.
And if you’re an active participant (you should be if you have the investing discipline), then you’re likely to lose some money.
But you can be on the lookout for the environment to change and prepare yourself to deal with what’s coming next.
That’s exactly what we’ve found with the current situation in the wake of the coming “grand reopening.”
Think about all the pent-up demand over the past year as countries locked down across the globe.
And now, things are beginning to reopen. As soon as they can, people will race to do all the things they missed out on in 2020.
Forget budgeting, forget planning out a week in advance. People are ready to drop everything to get a taste of normalcy.
This massive, upcoming flood will lead certain “COVID recovery” stocks to triple-digit gains in the months ahead as this trend plays out.
**
Related stories:
Bull Market Can Run to 2030 But Beware Coming Four-Year Cycle