
As the Global Head of J.P. Morgan’s Quantitative and Derivatives Strategy, Marko Kolanovic has been called a guru by Bloomberg News.
That’s because since the COVID-induced stock market crash in March and stay-at-home orders, which introduced so much economic and market uncertainty, he’s been unerringly accurate in predicting the trajectory of the stock market.
At the depths of the stock market’s turbulence, Kolanovic argued the market would reach all-time highs in 2021. It’s well ahead of schedule.
He doubled down on that assertion in April, and in June, Kolanovic shook off any remaining caution and said investors should be buying stocks. Right, right and right.
Now, in a new report Kolanovic has produced along with his colleague Bram Kaplan, he’s saying Donald Trump’s chances for re-election are improving and that investors would be wise to position themselves for that possibility.
Here are some excerpts from J.P. Morgan’s report:
In March, we were the first to argue that the market will reach all-time highs (ATH) in 2021, and after the Fed’s second intervention in April, we elaborated why ATH is likely to come even earlier.
This was not just considered contrarian, but also ridiculed at the time. Standing solidly above ATH at the end of August, the question is what is next for markets and the economy?
The answer to this is tied to the outcome of the US election as well as the progression of COVID-19.
In fact, all three – markets, COVID-19 and chances of Trump being re-elected – are closely and causally related to each other.
In this note, we share our analyses of recent developments and conclude that Trump’s re-election chances are rising and are already higher than currently reflected in investment styles.
The impact on sectors and factors – momentum vs value, cyclicals vs tech, environmental, social, governance (ESG) – could be dramatic and investment portfolios should adjust for a potential Trump re-election.
K-Shaped Recovery
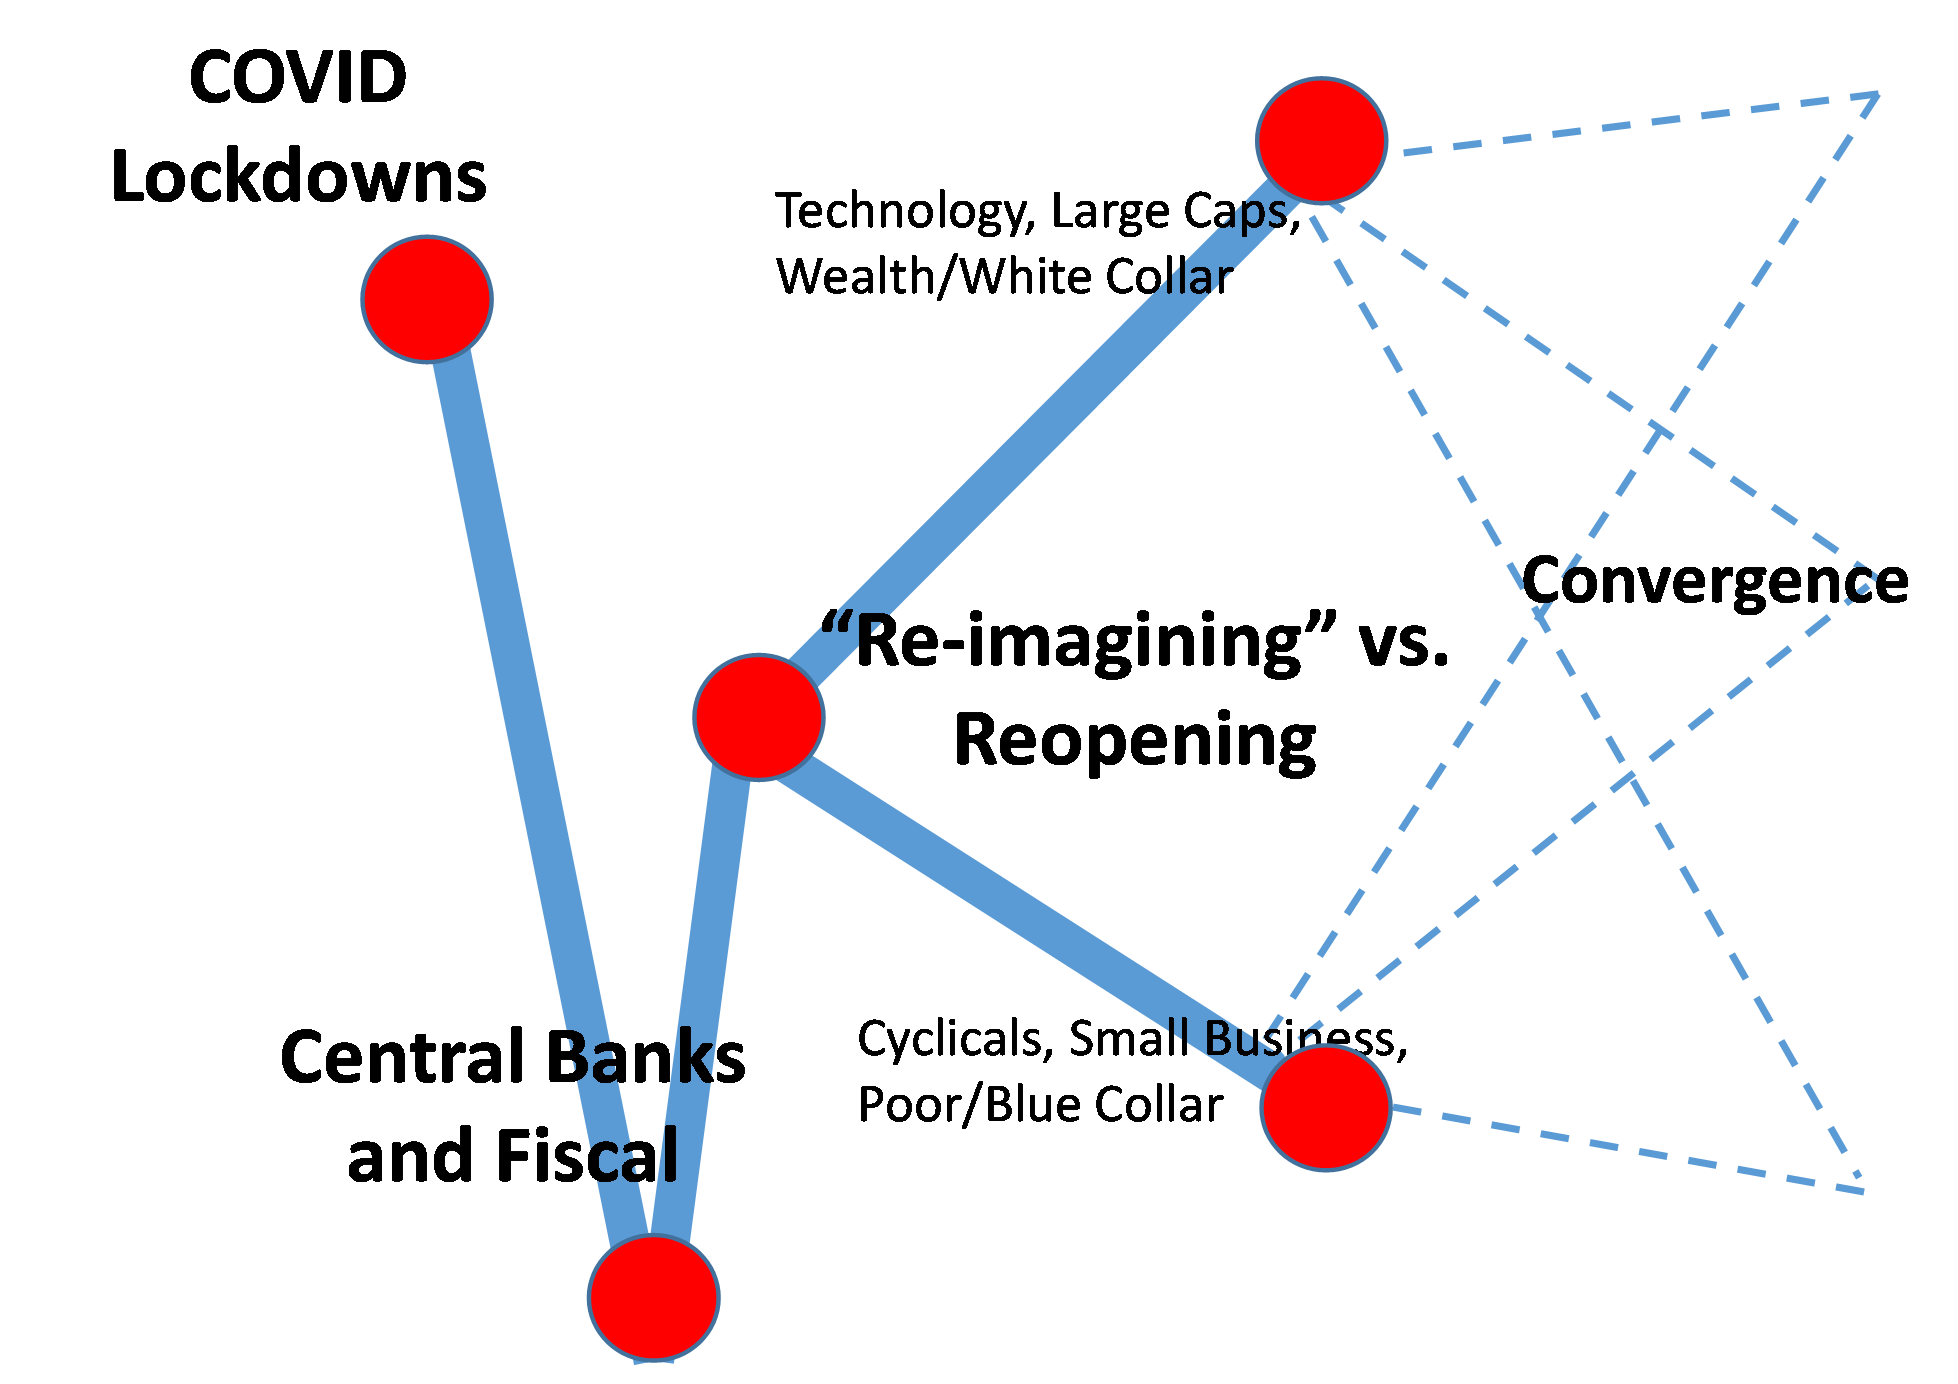
In the first half of the year, investors debated the shape of the economic recovery. Will it be V, W, U or something else? We believe this is now settled and that we are seeing a ‘K-shaped’ recovery (see Figure 1 below).
The pandemic and economic shutdowns caused a vertical drop that was exaggerated by market structure. Fed actions in March and April almost instantaneously reversed some of the losses.
Then in early May, with conditions being met for gradual reopening, the political decision was to emphasize re-imagining a new economy, rather than re-opening the old one.
This was the fork in this K-shaped recovery, where the technology sector took off to rally to ~20% above previous all-time highs, while cyclical market segments significantly lagged.
While the “new normal” of remote work and distancing benefits some (e.g. large cap tech companies), it is simply not sustainable long-term.
Without direct government transfers (stimulus and unemployment paychecks), continued central bank interventions, and massive borrowing from future generations, this “new normal” would have already collapsed.
We think that political and economic convergence of the K-shaped ‘recovery’, i.e. convergence of COVID-19 winners and losers, is ahead of us (i.e. unwind of the “new normal”).
Figure 1: The K-shaped recovery is likely to converge.
Source: J.P. Morgan Quantitative and Derivatives Strategy
Figure 2: Biden-Trump election betting odds
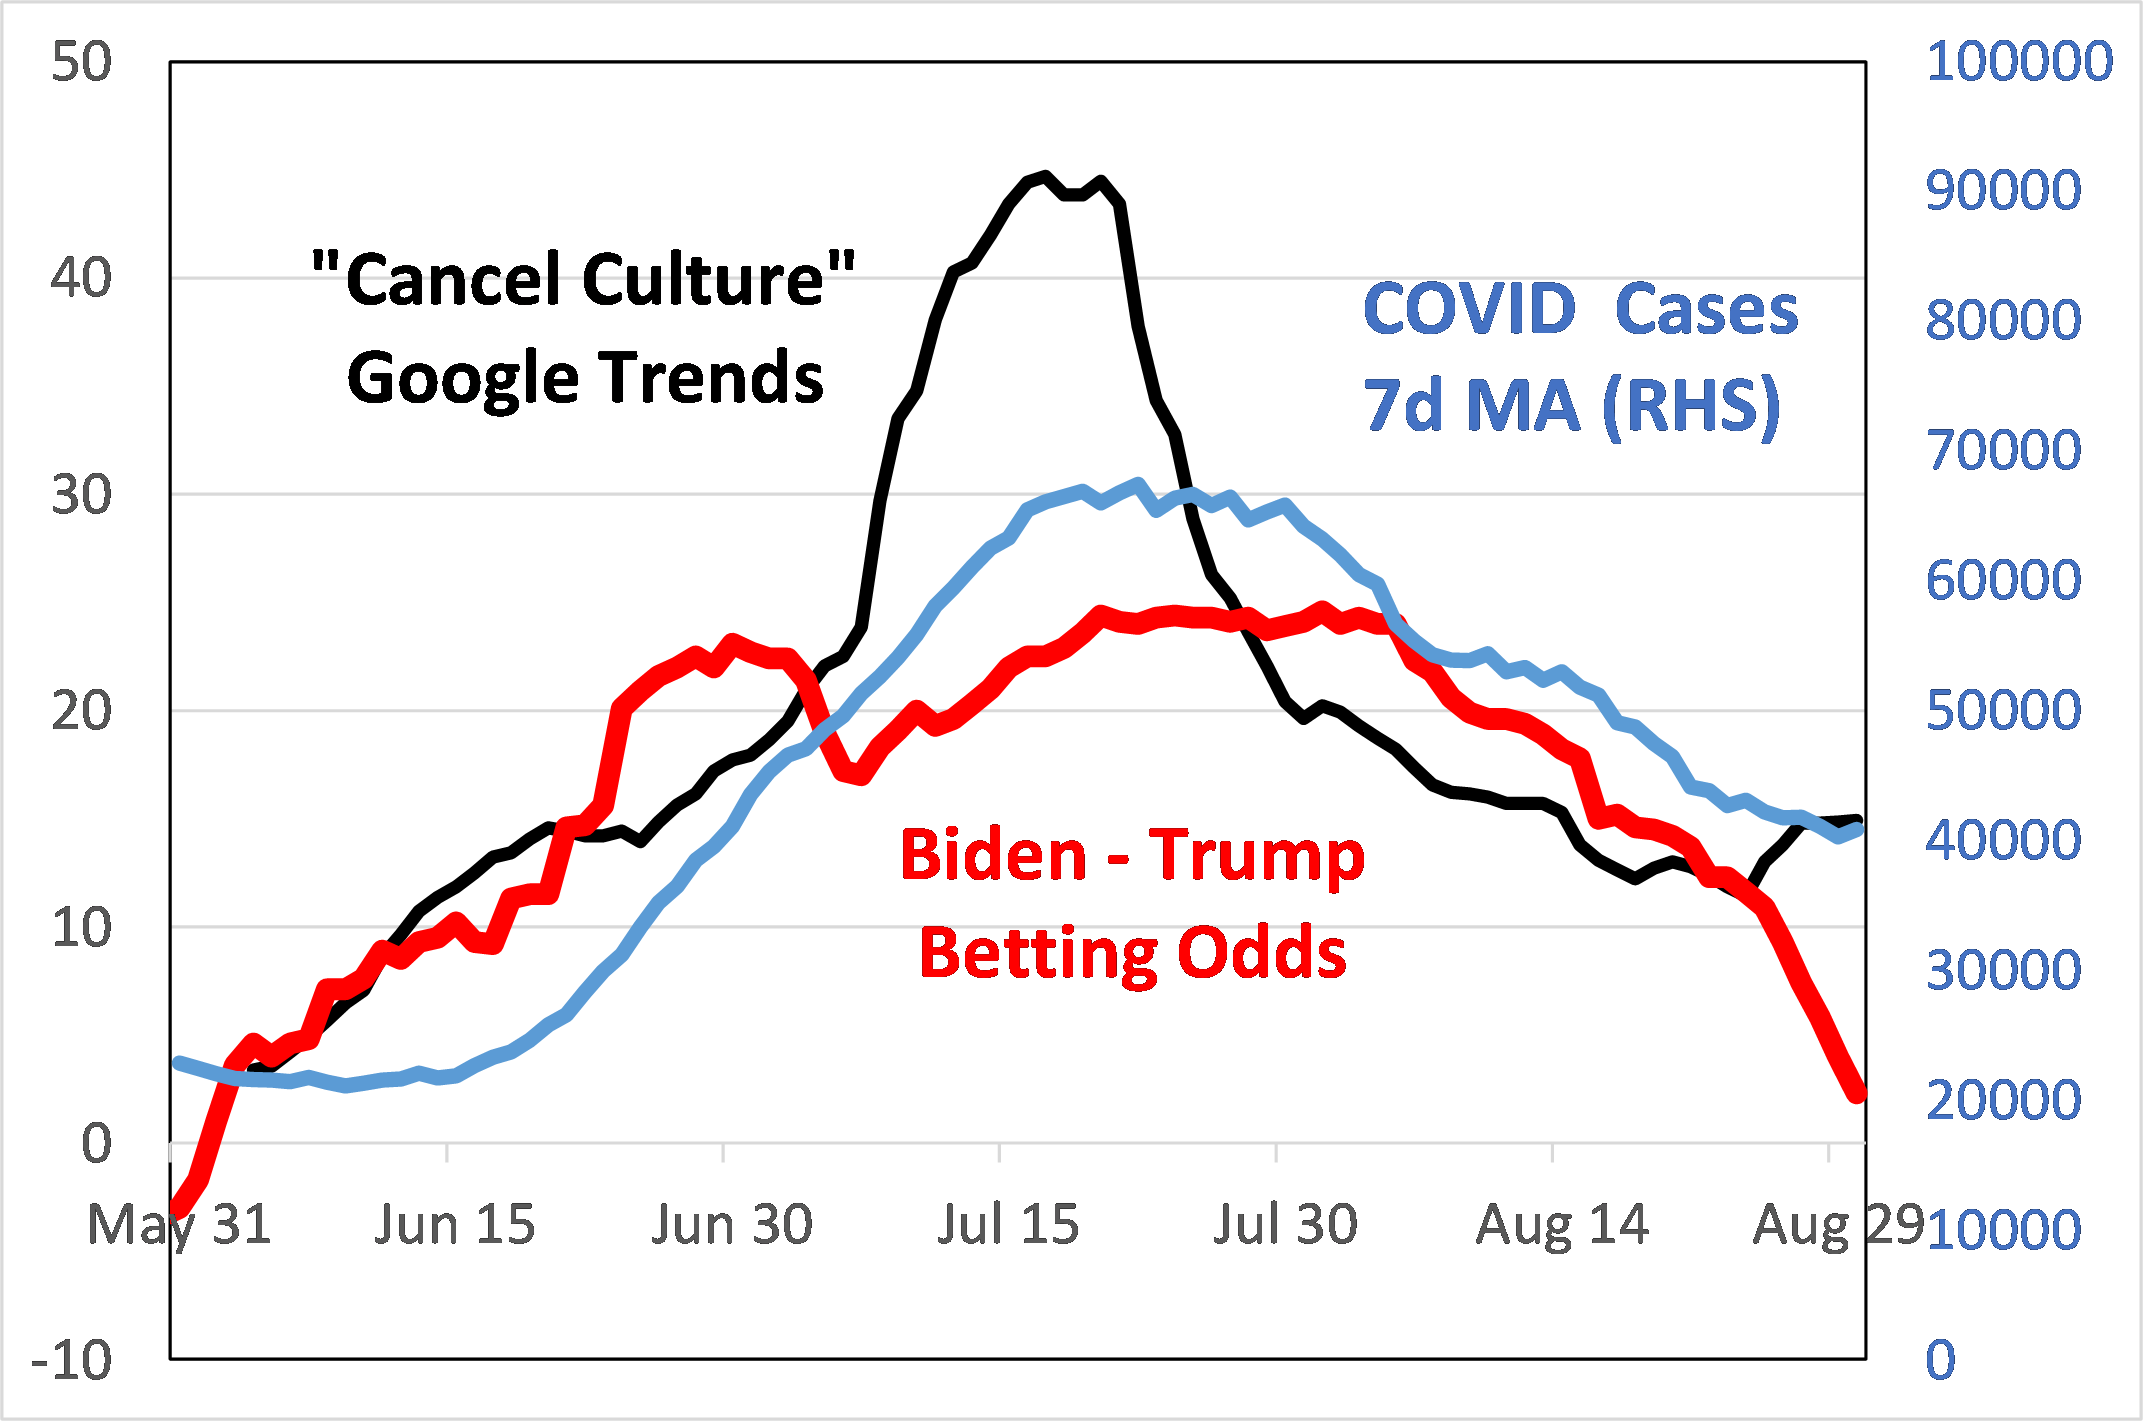
Source: J.P. Morgan QDS, RealClearPolitics.com, Google, JHU CSSE
US Elections
Over the past few days, Trump’s betting odds are rapidly increasing, and we analyze and quantify two effects that we believe are driving this shift and may significantly impact the election outcome.
Trump’s betting odds started plummeting with the onset of large protests in early June. During the month of August, Trump was as much as 25 points behind and investors took Biden’s election for granted, which we cautioned this may be premature.
However, during the month of August, Trump’s betting odds started improving, with the largest increase happening over the past week. Currently, betting odds have Trump virtually tied with Biden (Figure 2).
We believe it is largely due to two effects:
1) The impact of the degree of violence in protests on public opinion and voting patterns.
2) A bias in polls due to Trump voters being more likely to decline or mislead polls.
The impact of protests
We based our quantitative analysis on the academic work of Omar Wasow (see here), and applied his work to the current situation.
By studying historical county level impacts of peaceful and violent demonstrations on US election results between 1960 and 1972, the author found that peaceful pro-democrat demonstrations helped Democrats by 2-3%, while violent pro-Democrat demonstrations helped Republicans by 2-8%.
Applying this to the current situation of nation-wide protests, based on historical regressions, one would expect a ~5-10 point poll shift from Democrats to Republicans if the perception of protests turns from peaceful to violent.
It is highly likely that social media distribution of videos of looting in Chicago, L.A. and NYC, arson in Minneapolis, Wisconsin, Portland, Seattle, etc. have led to a significant shift in election odds in favor of Republicans.
Furthermore, by doing statistical simulation of the 1968 election, the author concluded that 1968 demonstrations directly resulted in the election of a Republican president.
The impact of protest violence on the 2020 elections may be even larger. The reason is the broad online availability of violent footage (everyone can record and share in real time), but also the ability to influence social media to amplify this message.
The second effect that is likely a driver of polls (or discrepancy between the polls and actual probabilities) was studied by Leib Litman (see here), who found that ~10% of Trump voters are likely not to be honest in polls (i.e. say they will vote for Biden while intending to vote for Trump), vs. ~5% of Biden voters.
Research suggests that the reasons for this include voters being afraid of reprisal (e.g. job termination) if their voting intentions are revealed, and others trying to ‘throw off’ polls.
Applying the findings of Litman’s research to the current breakdown of likely voters (Democrats, Republicans, independents, as well as Republicans voting Democrat and vice versa), we find that this ‘cancel culture’ effect could artificially skew polls in favor of Biden by 5-6%.
Implications, drivers going into the election?
We believe that momentum related to the Wasow effect will continue in favor of Trump, unless Democrats pivot away from their stance regarding demonstrations.
Another important driver in determining both the market direction and election outcome is the progression of COVID-19. Figure 2 shows that daily US COVID-19 cases also correlate with Trump betting odds.
New COVID-19 cases rate has been declining by about ~20,000 cases/day per month. Given that there are no very large states that have yet to see widespread outbreaks that can significantly boost new cases, this will likely set the pandemic on course to subside in time for the election.
Debates Looming
The last important driver of election odds will be the outcome of presidential debates.
Recent polls suggest that 61% of voters think Biden should address the question of dementia publicly, and 52% are either not sure or think that Biden has the condition.
Certainly a lot can happen in the next ~60 days to change the odds, but we currently believe that momentum in favour of Trump will continue, while the most investors are still positioned for a Biden win.
Implications could be significant for the performance of factors, sectors, COVID-19 winners/losers, as well as ESG.
**
Related stories: 55 Things You Need to Know About Kamala Harris
Inside Trump’s Debate Prep