If you’re a regular visitor to the Uncommon Sense Investor website or, better yet, a subscriber to our free newsletter, you’ve noticed we produce original content through videos and blogs.
We also curate investment research, and aggregate articles and investment newsletters that we think are of high quality and of value to investors.
With the latter in mind, we present a bevy of interesting charts courtesy of the free daily newsletter of well-known value investor, author and avid mountaineer and extreme sports enthusiast, Whitney Tilson, who runs Empire Financial Research.
Based on research from hedge fund manager Mark Spiegel of Stanphyl Capital, there’s a compelling case to be made that the major U.S. stock market indices and, more specifically, technology stocks are in a bubble of epic proportions.
Some of the froth has come out of Tesla et al recently but the extreme valuations don’t necessarily mean the bull market is over. In fact:
The Nasdaq Composite Index in 1997 and 1998 had three corrections of 17 per cent or more and eventually rose fourfold before it peaked in 2000, such was the irrational exuberance of investors back then.
Here are some excerpts from Tilson’s newsletter which quotes extensively from Spiegel’s work, bearing in mind this was originally published on September 2:
So our short positions have obliterated the profits from our long positions, and yet when this bubble pops we’ll be glad we have them.
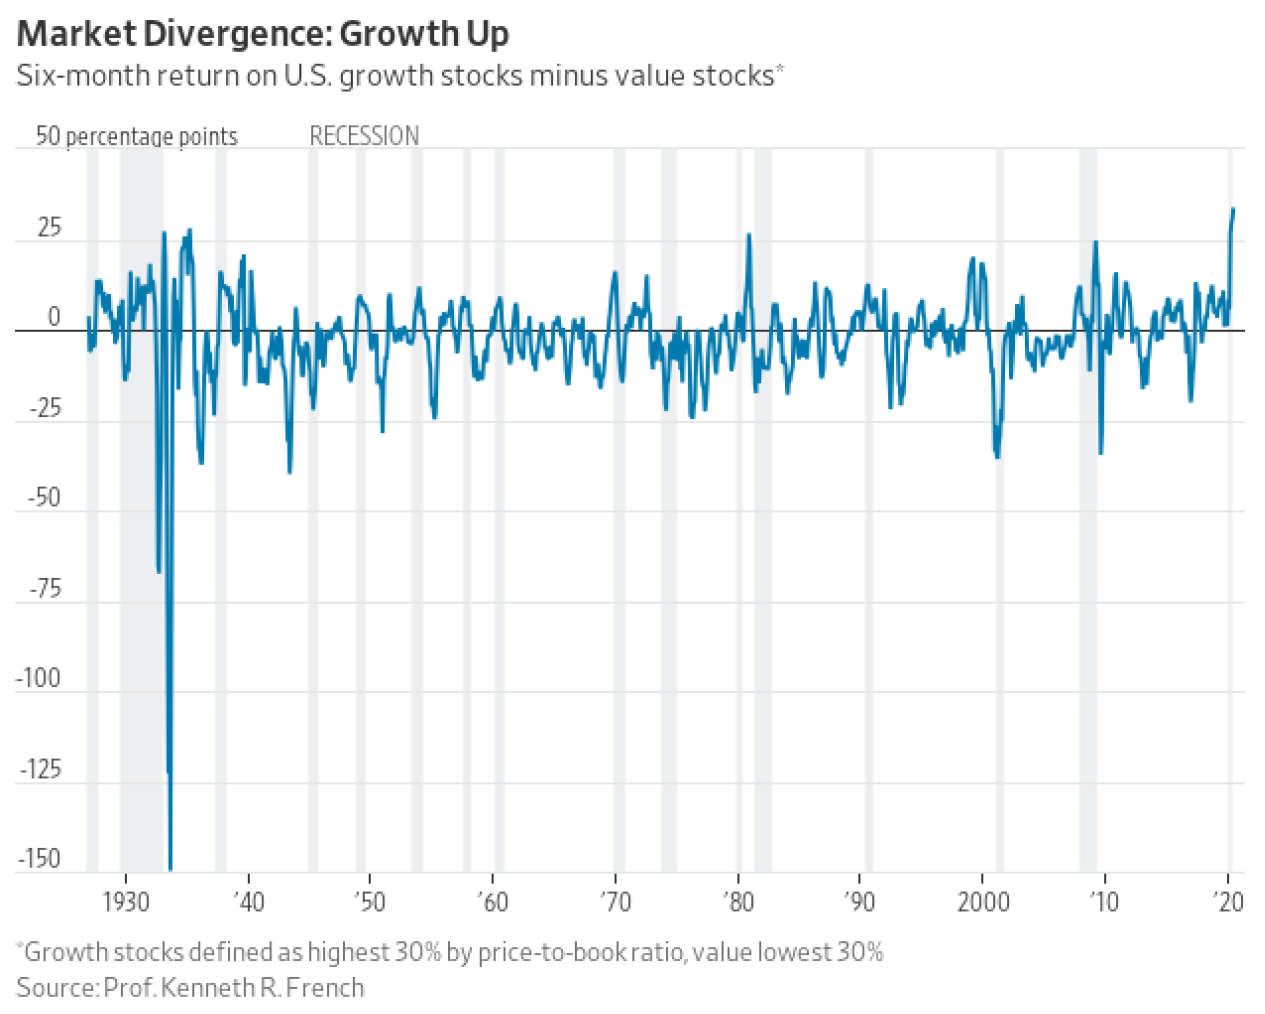
The dichotomy between our longs and our shorts is well illustrated in this chart showing a record divergence between the performance of “growth stocks” vs. “value stocks,” yet I believe that as has always happened in the past, this will mean-revert in our favour:
Later, Spiegel explains why he’s maintaining a large short position in the Invesco QQQ Trust (QQQ), an exchange-traded fund that tracks the Nasdaq 100 Index:
I have a “near-term reason” and a “long-term reason.” Near-term, bullish speculation is (literally) off the charts: for the last two weeks the Put-Call (options contracts to buy at lower or higher prices) ratio for Nasdaq 100 constituent stocks closed at the extremely low (i.e., “complacent”) level of 0.42 and intra-day today it hit 0.21, which may be the lowest level ever.
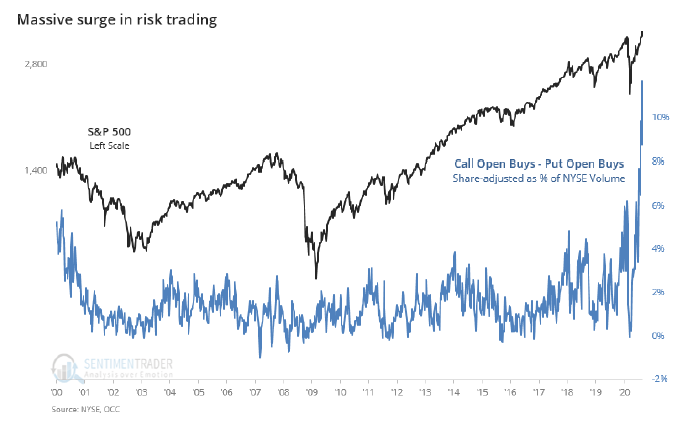
Meanwhile, @SentimenTrader points out that call option buying as a percentage of NYSE volume far exceeds that of the 2000 bubble era…
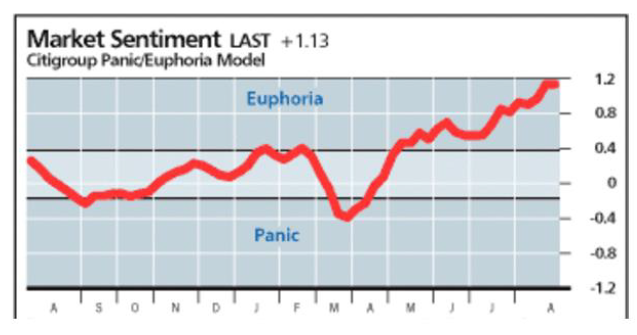
… while @hmeisler shows us that Citi’s Panic/Euphoria index is well into “Euphoria” mode – by far the highest it’s been since the bubble peak in 2000 (when it hit approximately 1.5):
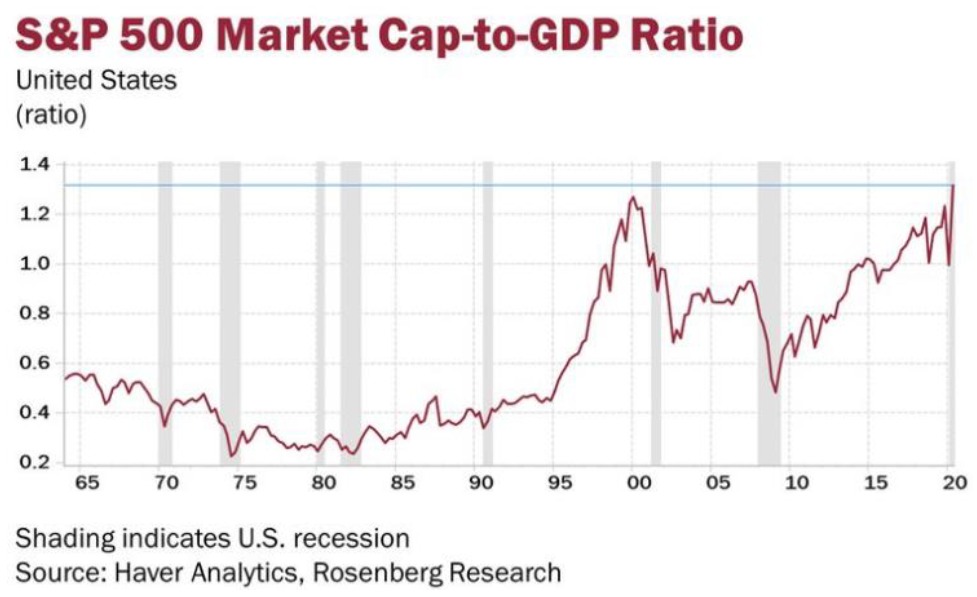
Valuation-wise, on a forward [price-to-earnings] basis, the S&P 500 is now at the peak of the 2000 bubble…
… while as a percentage of GDP the S&P 500 now exceeds the 2000 bubble’s peak…
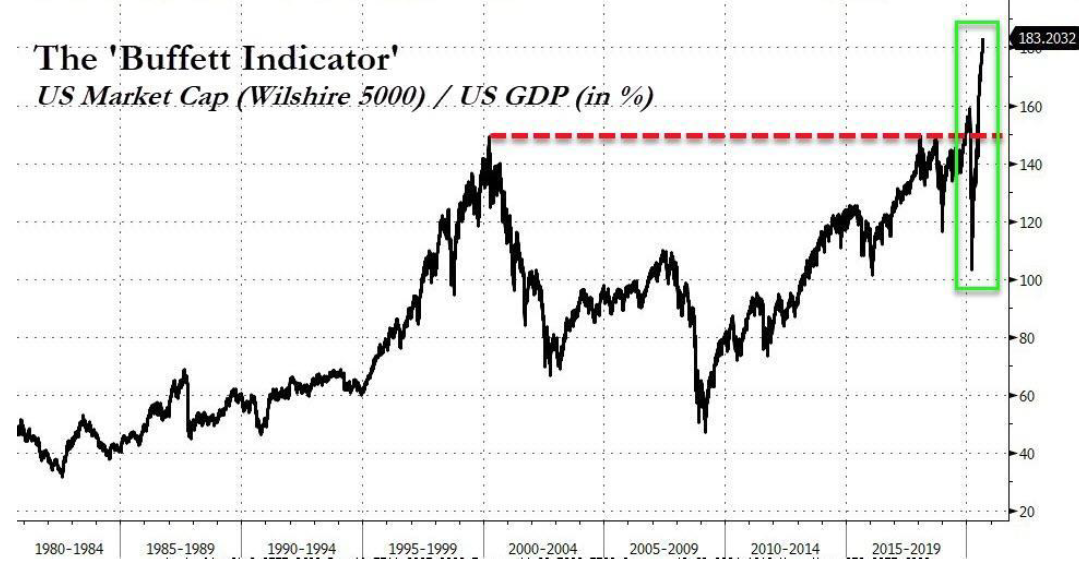
… and the broader stock market (the Wilshire 5000) hugely exceeds the 2000 peak:
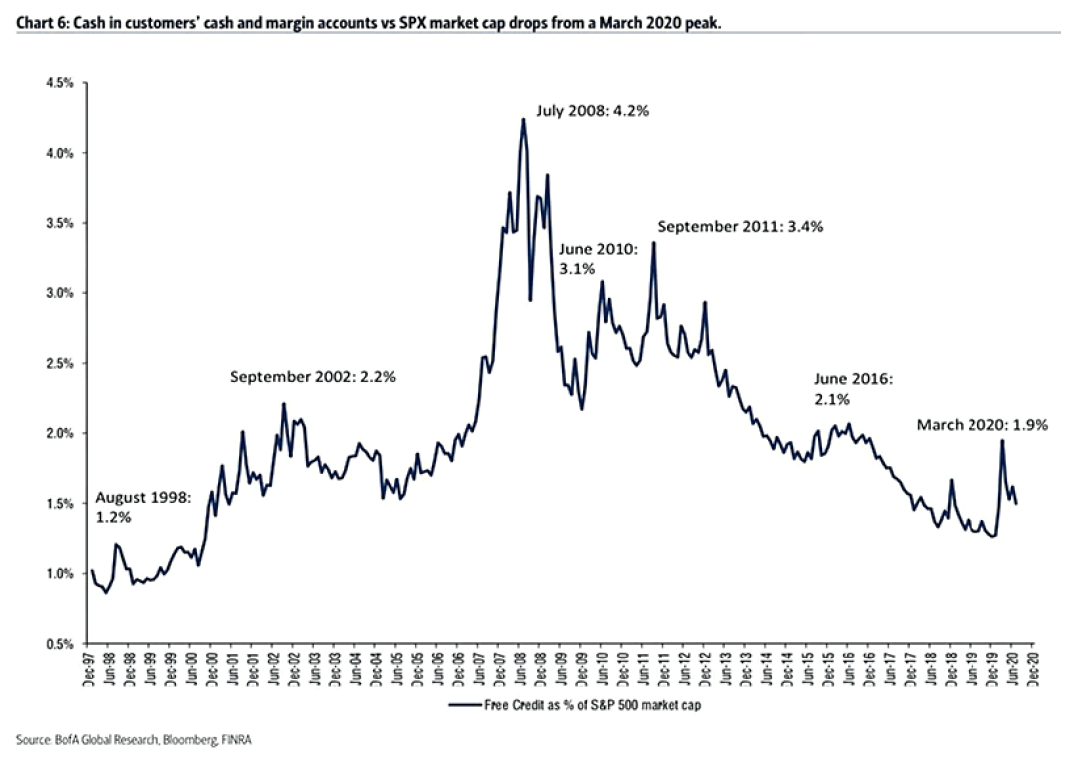
And from @ISABELNET_SA we can see that available buying credit (cash) in customer accounts as a percentage of S&P 500 market cap is down near the level it was at the peak of the 2000 bubble…
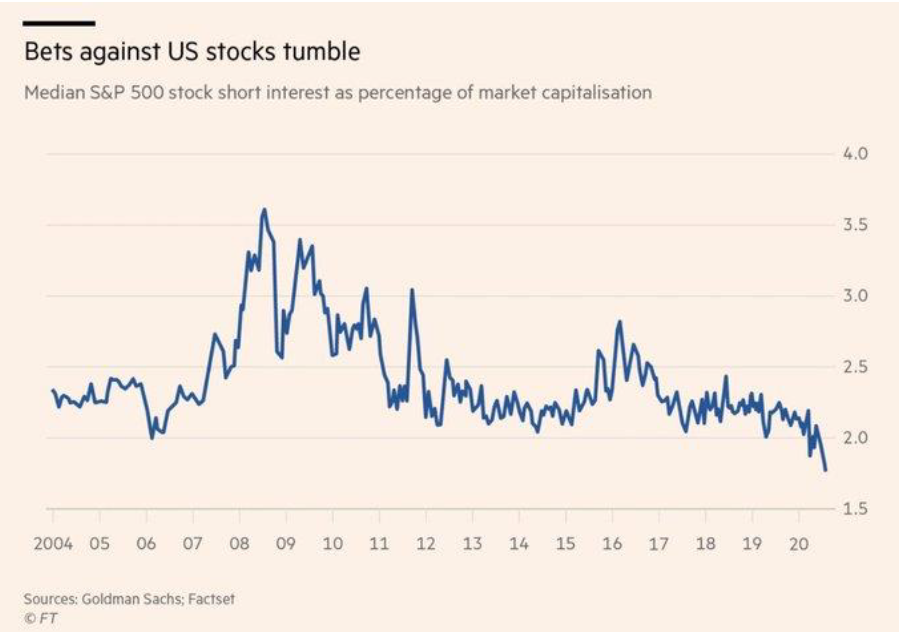
… while as @Fxhedgers points out, there are almost no shorts left:
So “excessive bullishness & complacency” is the near-term reason why I maintain our QQQ short position.
Medium-to-longer-term I believe the Federal Reserve’s endless money-printing combined with massively profligate deficit spending from both parties in Washington and growth-retarding levels of debt will return us to an environment similar to the stagflationary 1970s; i.e., slow growth and high inflation (which we got a hint of this month).
In that environment, high-flying stocks (such as the QQQ we’re short) will suffer massive PE multiple compression, and gold (which we’re long) will climb steadily.