
No one likes to see the value of their portfolio go down. All that red on the screen can be disturbing.
But pullbacks, corrections and crashes are part of long-term investing.
It’s how an investor deals with their emotions that matters.
We’re now dealing with the aftermath of an exhilarating, sometimes manic and euphoric bull market run since the pandemic lows.
Many investors are asking, “Is this it? Is this the big one?”
Others wonder whether this is a much needed correction for stocks, and if the economic environment is generally strong enough to support further gains.
BCA Research has been monitoring economies and financial markets for years.
They’ve come up with some answers to their clients’ most recent frequently asked questions.
Here are a handful of questions, answers, and charts from a report by Chief Global Strategist, Peter Berezin.
**
Highlights
- The selloff in equities since the start of the year marks a long overdue correction rather than the start of a bear market.
- Stocks often suffer a period of indigestion when bond yields rise suddenly, but usually bounce back as long as yields do not move into economically restrictive territory.
- BCA’s bond strategists expect the 10-year yield to rise to 2%-to-2.25% by the end of the year, which is well below the level that could trigger a recession.
- While valuations in the US remain stretched, they are much more favourable abroad. Investors should overweight non-US markets, value stocks, and small caps in 2022.
- Go long homebuilders versus the S&P 500. US homebuilders are trading at only 6.5-times forward earnings and will benefit from tight housing supply conditions and a moderation in input costs.
Q: What do you see as the main reasons for the equity selloff?
A: At the start of the year, the S&P 500 had gone 61 straight weeks without experiencing a 6% drawdown, the third longest stretch over the past two decades.
Stocks were ripe for a pullback.
The backup in bond yields provided a catalyst for the sellers to come out.
Not surprisingly, growth stocks fell hardest, as they are most vulnerable to changes in the long-term discount rate.
At last count, the S&P 500 Growth index was down 13.7% YTD, compared to 4.1% for the Value index.
Our research has found that stocks often suffer a period of indigestion when bond yields rise suddenly, but usually bounce back as long as yields do not move into economically restrictive territory.
BCA’s bond strategists expect the 10-year yield to rise to 2%-to-2.25% by the end of the year, which is well below the level that could trigger a recession.
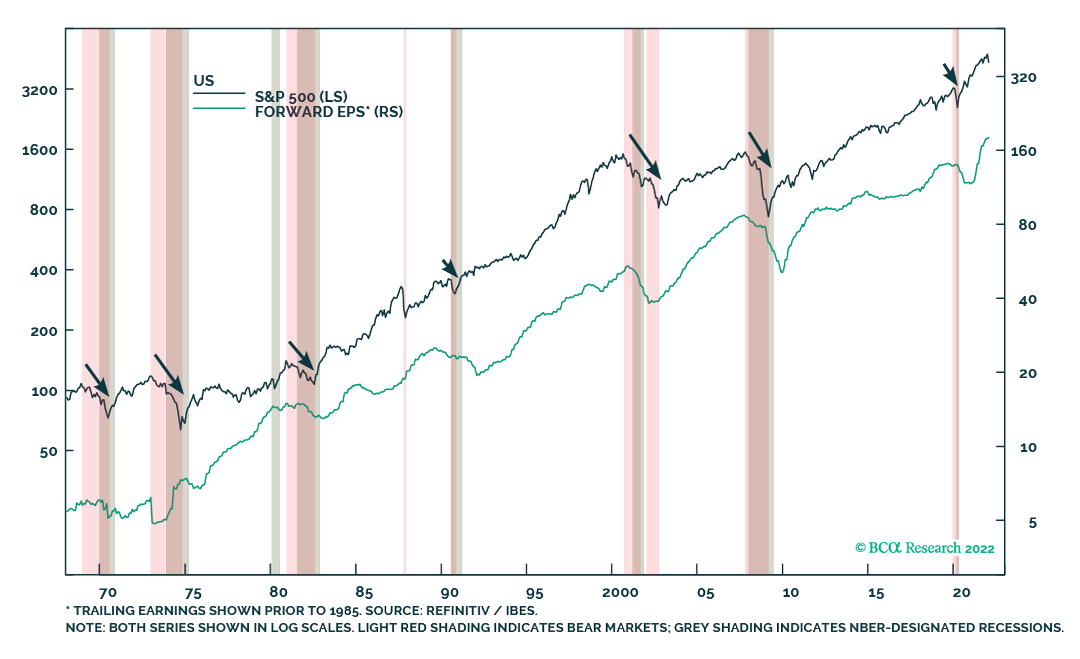
Historically, equity bear markets have coincided with recessions (Chart 1).
Corrections can occur outside of recessionary periods, but for stocks to go down and stay down, corporate earnings need to fall.
That almost never happens unless there is a major economic downturn.
In fact, the only time in the last 50 years the US stock market fell by more than 20% outside of a recessionary environment was in October 1987.
Chart 1. Recessions And Bear Markets Tend To Go Hand In Hand
Q: To the extent that the Fed is trying to engineer tighter financial conditions, doesn’t this imply that stocks must continue falling?
A: That would be true if the Fed really did want to tighten financial conditions, either via lower stock prices, a stronger dollar, higher bond yields, or wider credit spreads.
However, we do not think that this is what the Fed wants.
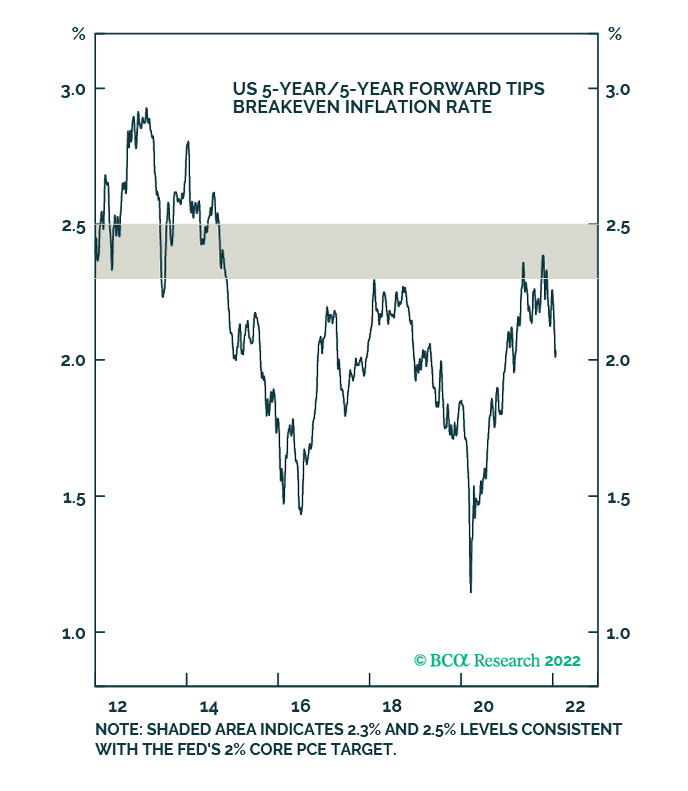
Despite all the chatter about inflation, the 5-year/5-year forward Treasury Inflation-Protected Securities (TIPS) breakeven inflation rate has fallen to 2.05%, which is 25 basis points below the bottom end of the Fed’s comfort zone (Chart 9).
Chart 9. Market-Based Long-Term Inflation Expectations Are Below The Fed’s Comfort Zone
Q: Valuations are still very stretched. Even if the conflict in Ukraine does not spiral out of control and the goldilocks macroeconomic scenario of above-trend global growth and falling inflation comes to pass, hasn’t much of the good news already been discounted?
A: US stocks are quite pricey.
Both the Shiller PE ratio and households’ allocations to equities point to near-zero total returns for stocks over a 10-year horizon.
That said, valuations are not a useful timing tool.
The business cycle, rather than valuations, tends to dictate the path of stocks over medium-term horizons of 6-to-12 months (Chart 19).
Chart 19. The Business Cycle Drives The Stock Market Over Medium-Term Horizons
")
**
Related stories: